on
Blog 2: Economy and Elections
Introduction:
This week, I focused on evaluating predictive models that used national economic variables as predictors for the incumbent party’s vote margin (%) in House congressional races. My goal was to better understand the economic model of voting behavior of congressional elections.
Previous Literature:
Achen and Bartels (2017) analyzed the economic model of voting behavior of presidential races. They found that, “it is possible to account for recent presidential election outcomes with a fair degree of precision solely on the basis of how long the incumbent party had been in power and how much real income growth voters experienced in the six months leading up to Election Day.” This led them to argue that this evidence challenges the idea that citizens are rational retrospective voters and instead argued that, “while they vote on the basis of how they feel at the moment, they forget or ignore how they felt over the course of the incumbents’ term in office” (Achen & Bartels, 2017).
I was fascinated by this finding and wanted to see if this trend would be replicated in congressional elections. As a result, I attempted to replicate Achen and Bartels’ predictive model, but for congressional elections. I kept the incumbent party’s vote margin (%) as the outcome variable. I included the change in real disposable income (RDI) as an independent variable and used the standard of the quarter before the election and the quarter before that as the time frame for the short term growth. Thus, I used the difference between Q7 and Q6 for congressional elections. However, I also used other national economic variables like change in consumer point index (CPI) and change in gross domestic product (GDP).
Model 1: Linear regression model of changes in economic variables
##
## ===========================================================
##                               Dependent variable:
##                     ---------------------------------------
##                     Incumbent Party's Vote Share Margin (%)
## -----------------------------------------------------------
## Change in CPI                       -1.742
##                                     (2.389)
##
## Change in RDI (%)                   -1.854
##                                     (1.884)
##
## Change in GDP (%)                   -0.346
##                                     (0.462)
##
## Constant                            7.086*
##                                     (3.471)
##
## -----------------------------------------------------------
## Observations                          31
## R2                                   0.040
## Adjusted R2                         -0.067
## Residual Std. Error             7.108 (df = 27)
## F Statistic                   0.370 (df = 3; 27)
## ===========================================================
## Note:                           *p<0.1; **p<0.05; ***p<0.01
The first predictive model that I evaluated was using the “change” predictors as I will call them: change in RDI, CPI, and GDP. Unlike Achen and Bartels’ model for long term and short term economic voting in presidential elections, my model for congressional elections was a poor predictor with an adjusted R squared of -0.067, which indicates that a model without any of the variables was a better predictor than with them. This could be because voters generally attribute how well or badly the economy is doing to the president, and perhaps not to the House of Representatives as much.
Model 2: Linear regression model of economic data of Q7
##
## ===========================================================
##                               Dependent variable:
##                     ---------------------------------------
##                     Incumbent Party's Vote Share Margin (%)
## -----------------------------------------------------------
## RDI in Q7                         -0.0004***
##                                    (0.0001)
##
## GDP in Q7                            0.002
##                                     (0.002)
##
## Constant                           12.710***
##                                     (2.271)
##
## -----------------------------------------------------------
## Observations                          31
## R2                                   0.395
## Adjusted R2                          0.352
## Residual Std. Error             5.538 (df = 28)
## F Statistic                  9.154*** (df = 2; 28)
## ===========================================================
## Note:                           *p<0.1; **p<0.05; ***p<0.01
I wanted to see if there were other economic indicators that were not based on change that could better predict congressional elections. Thus, I evaluated a predictive model that used national economic indicators of the RDI and GDP values at the end of Q7. The theory behind this was perhaps that voters cannot measure the change in values as much as they remember the most recent economic statistic. This model was much more predictive than the previous because it had an adjusted R squared of 0.352, which indicates that the economic variables in this model predicted about 35.2% of the incumbent party’s vote share margin percentage.
Model 3: Linear regression model of all economic variables
##
## ===========================================================
##                               Dependent variable:
##                     ---------------------------------------
##                     Incumbent Party's Vote Share Margin (%)
## -----------------------------------------------------------
## Change in CPI                        0.275
##                                     (1.921)
##
## RDI in Q7                          -0.001***
##                                    (0.0001)
##
## Change in RDI (%)                  -3.016**
##                                     (1.421)
##
## GDP in Q7                            0.012
##                                     (0.021)
##
## Change in GDP (%)                   -2.227
##                                     (3.501)
##
## Constant                           17.549***
##                                     (3.884)
##
## -----------------------------------------------------------
## Observations                          31
## R2                                   0.540
## Adjusted R2                          0.448
## Residual Std. Error             5.112 (df = 25)
## F Statistic                  5.870*** (df = 5; 25)
## ===========================================================
## Note:                           *p<0.1; **p<0.05; ***p<0.01
My final predictive model was combining all of the economic indicators (the “change” ones and not “change” ones). This model had the highest adjusted R squared of 0.448. A very interesting trend with this model is that the change in RDI had a statistically significant negative relationship with the incumbent party’s vote share margin. In this model, for every point that the change in RDI increases, the incumbent party’s vote share margin decreases by about 3.016 percentage points. This is the complete opposite to what Achen and Bartels had found with presidential elections so I was shocked.
Graphs
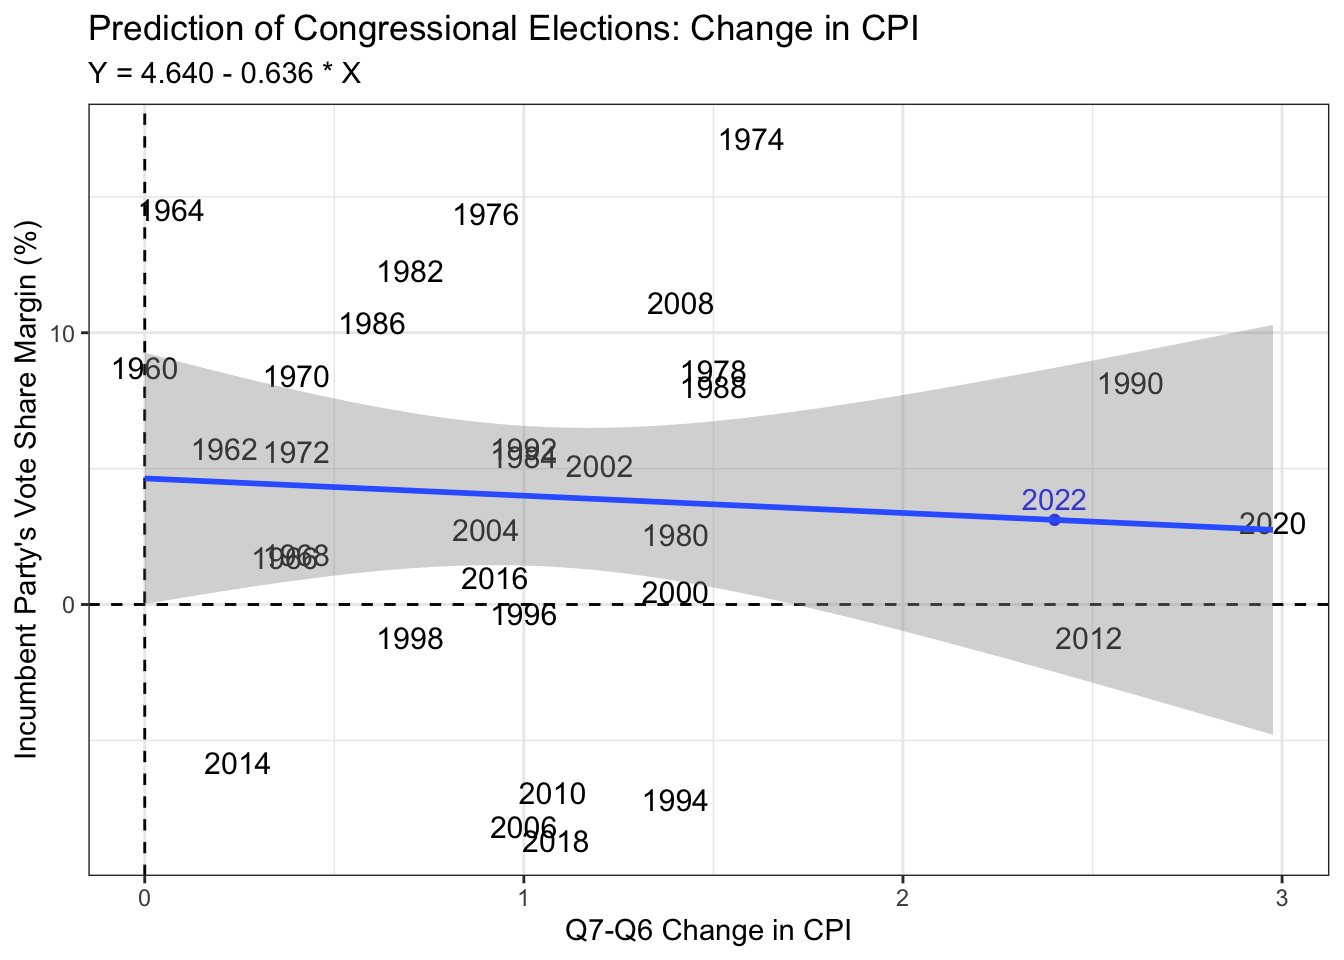
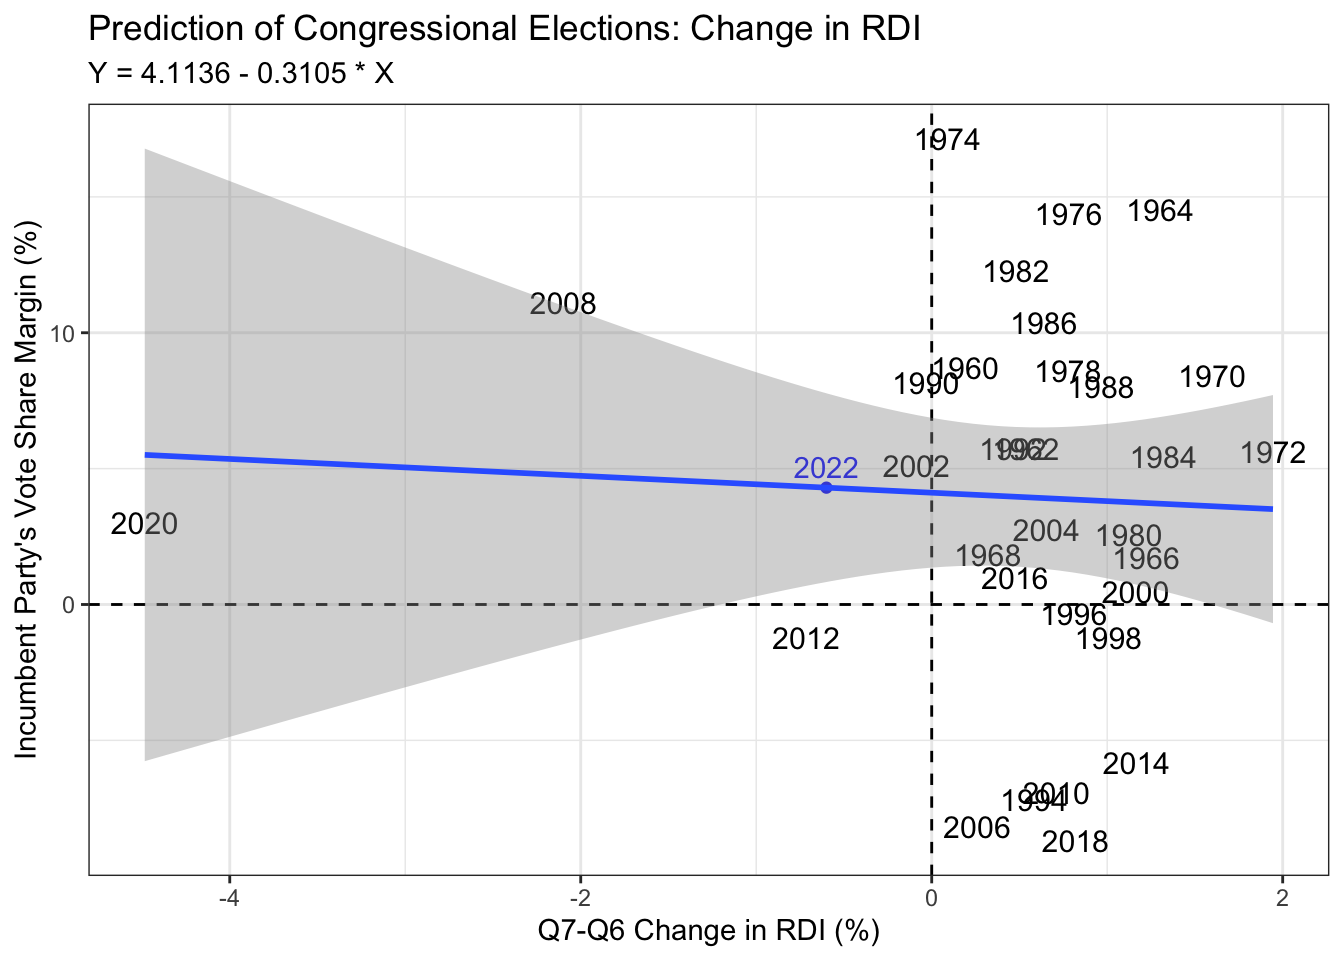
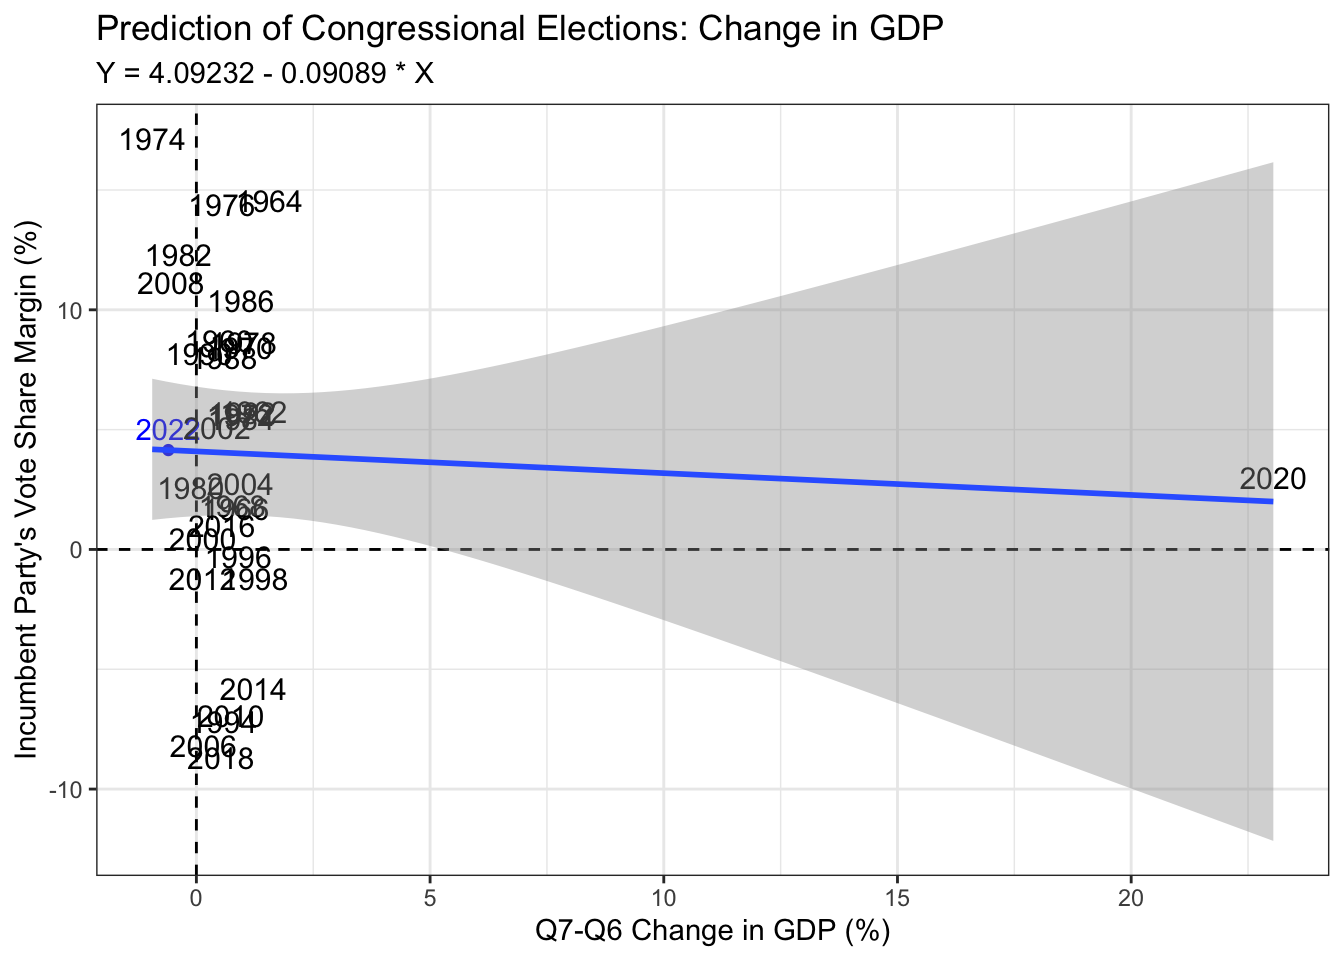
However, when you plot the “change” economic predictors, the story becomes more complicated. I plotted my 2022 prediction in blue, but I am not confident in it. For example, it seems that 2020 is an outlier that is affecting most, if not all, of the economic predictors. Thus, I am not 100% sold on the idea that congressional elections have an opposite relationship to presidential elections in terms of the incumbent party’s vote share margin and change in RDI. Also, why did change in RDI only become a statistically significant predictor in the final model when all of the economic variables (the raw values at Q7) were added? I think this requires further research whether that is interaction of variables or a whole other variable that could better explain congressional elections. In particular, I’m curious why raw values of economic indicators better explain the incumbent party’s vote share margin than change in the variables.
In my humble opinion so far, I think economic variables, such as short term change in RDI, are not as good indicators of the incumbent party’s vote share margin for congressional elections as they are for presidential elections.
Sources: Christopher H Achen and Larry M Bartels. Democracy for Realists: Why Elections Do Not Produce Responsive Government, volume 4. Princeton University Press, 2017. For 2022 economic data, I used Q2 (the most recent) data from https://www.bea.gov/news/2022/gross-domestic-product-second-estimate-and-corporate-profits-preliminary-second-quarter