on
Blog 3: Polling
Introduction:
This week, I focused on polling to help predict the 2022 House party seat share (%) for Democrats and Republicans.
What Do Forecasters Do?
FiveThirtyEight’s approach to forecasting congressional elections is as follows, “take lots of polls, perform various types of adjustments to them, and then blend them with other kinds of empirically useful indicators (what we sometimes call “the fundamentals”) to forecast each race. Then they account for the uncertainty in the forecast and simulate the election thousands of times” (Silver, 2022). In other words, in the “classic” version of their House forecast, FiveThirtyEight uses district-by-district polls and then adds “fundamentals” aka non-polling factors, including incumbency, past voting history in the state or district, fundraising, and the generic ballot.
The Economist’s approach to forecasting the 2020 congressional election was done in three basic steps. First, the model needed to “predict an accurate range of outcomes for the national popular vote for the House—the sum of all votes cast for Democratic or Republican House candidates, with an adjustment for seats where one party is running unopposed” (Morris, 2020). To do this, they used generic-ballot polling, presidential approval ratings, average results of special elections held to fill vacant legislative seats, and the number of days left until the election. Then, the model needed to use this data from the overall national political environment to try to forecast at the district level. Similar to FiveThirtyEight, they used “fundamentals” like historical voting record and incumbency to “predict each district’s “partisan lean”—the gap between the election result in each district and the overall national average” and if there were any, local polls (Morris, 2020). Finally, the model randomly simulated a result in each race 10,000 times for the forecast.
Personally, I believe that the Economist has a better approach to forecasting because of its consideration of presidential approval ratings and number of days left until the election for the overall national political environment. Research shows that the president’s party usually suffers during midterm elections. This could be because voters tend to use the president as a heuristic for judging the Congressional parties. Furthermore, we know from Gelman and King (1993) that the number of days left until the election matters for the accuracy of the polls. They state, “In most years, early public opinion polls give fairly miserable forecasts of the actual election outcome… Additionally, in virtually every presidential election in the last forty years, the polls converge to a point near the actual election outcome shortly before election day” (Gelman & King, 1993). It is important that we take earlier polls with a grain of salt and not get stuck into the “horse” race of election polling like Gelman and King state. In addition, FiveThirtyEight relies more on local polling, which I believe might have too much variation and uncertainty.
What is the generic congressional ballot?
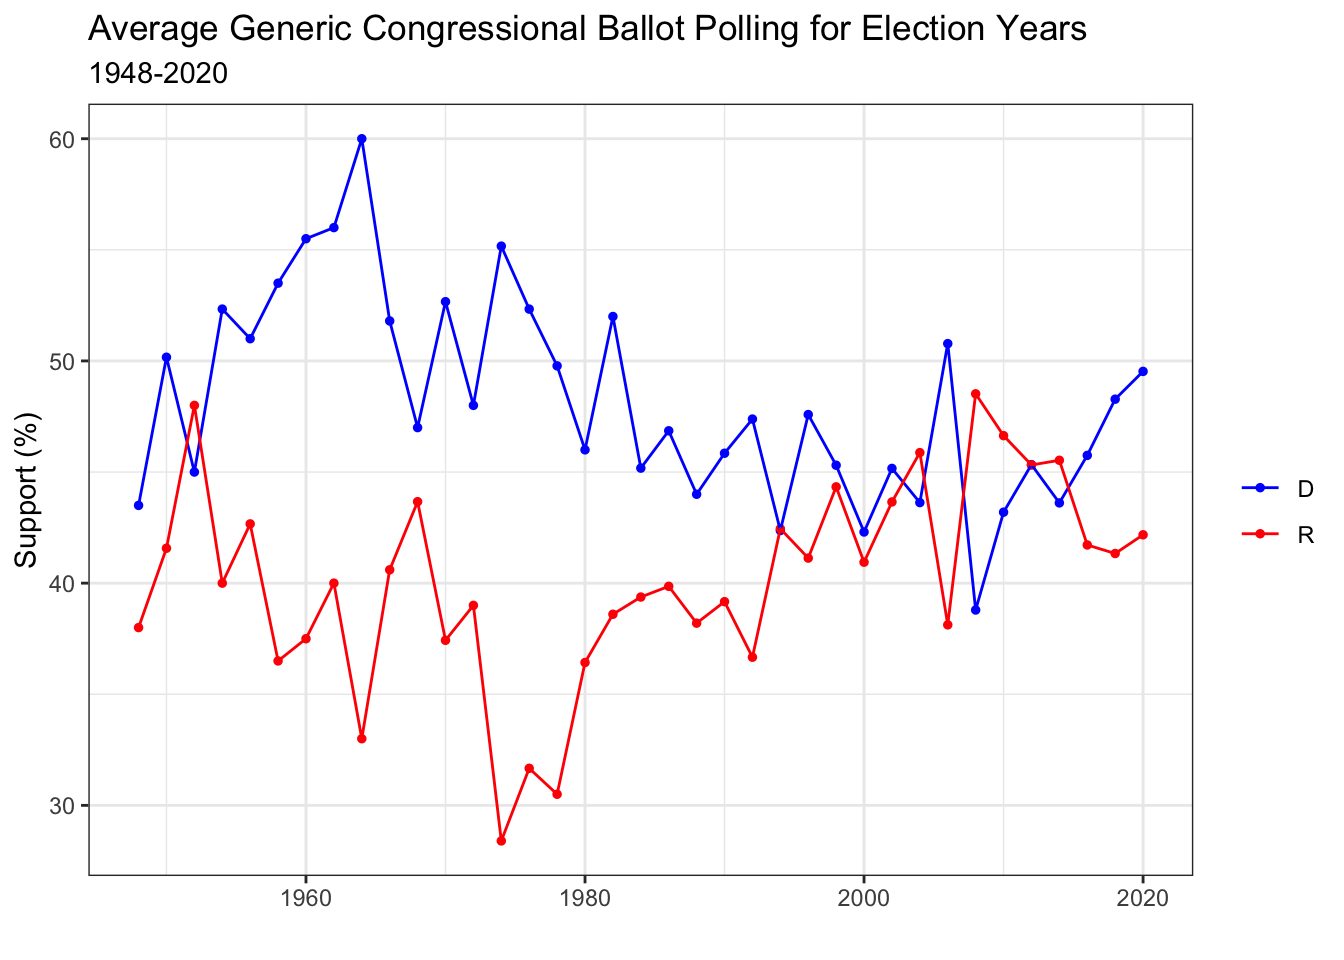
The generic congressional ballot is a poll that asks voters which party they would support in the election, rather than individual candidates. The question is usually something like this, “If the elections for U.S. Congress were being held today, would you vote for the Republican Party’s candidate or the Democratic Party’s candidate for Congress in your district?”
Drawing upon Gelman and King (1993) again, I made the decision to filter the generic ballot polling data for only polls 52 days away from or closer to the election because the closer the poll is to the actual election day, the more likely it is to be closer to the actual election result. The 52 day cutoff was chosen because I was limited by the data; the closest poll to election day in 1952 was 51.5 days. Thus, the graph above shows the average of all the polls, before and including 52 days away from election day, for one year. In this week’s blog, I did not include any weights like pollster quality and simply filtered for the relevancy. As you can see in the graph, in the earlier elections, the Democrats were consistently getting higher scores than their Republican counterparts, but in the more recent elections, the gap between support for Democrats and Republicans has dramatically decreased.
Predicting House seat share by generic ballot poll
This week, I chose to use the two parties’ final House seat share (%) as the outcome variable. Thus, I explored using generic ballot polls to predict House seat share for Democrats and Republicans.
##
## ===============================================================
##                                        Dependent variable:
##                                   -----------------------------
##                                   Democrat House Seat Share (%)
## ---------------------------------------------------------------
## Average Generic Ballot Poll Score           0.882***
##                                              (0.205)
##
## Constant                                     12.804
##                                              (9.920)
##
## ---------------------------------------------------------------
## Observations                                   37
## R2                                            0.346
## Adjusted R2                                   0.327
## Residual Std. Error                      5.666 (df = 35)
## F Statistic                          18.511*** (df = 1; 35)
## ===============================================================
## Note:                               *p<0.1; **p<0.05; ***p<0.01
In this simple linear regression model for the Democrat House seat share (%), we see that for every one percentage point increase in the average generic ballot poll score for Democrats, there is a 0.882 percentage point increase in Democratic House seat share. This was also statistically significant at the 95% confidence level. The R squared is 0.346, which means that generic ballot polling alone explained 34.6% of the variation in Democrat House seat share.
##
## =================================================================
##                                         Dependent variable:
##                                   -------------------------------
##                                   Republican House Seat Share (%)
## -----------------------------------------------------------------
## Average Generic Ballot Poll Score            1.175***
##                                               (0.160)
##
## Constant                                      -2.449
##                                               (6.469)
##
## -----------------------------------------------------------------
## Observations                                    37
## R2                                             0.606
## Adjusted R2                                    0.595
## Residual Std. Error                       4.398 (df = 35)
## F Statistic                           53.811*** (df = 1; 35)
## =================================================================
## Note:                                 *p<0.1; **p<0.05; ***p<0.01
The linear regression model for the Republican House seat share (%) showed similar results. For every one percentage point increase in the average generic ballot poll score for Republicans, there is a 1.175 percentage increase in Republican House seat share, which was also statistically significant at the 9% confidence level. The R squared is 0.606, which means that generic ballot polling alone explained 60.6% of the variation in Republican House seat share.
These two linear regression models contribute to the common idea that the generic ballot is a strong predictor of the election results.
## `geom_smooth()` using formula 'y ~ x'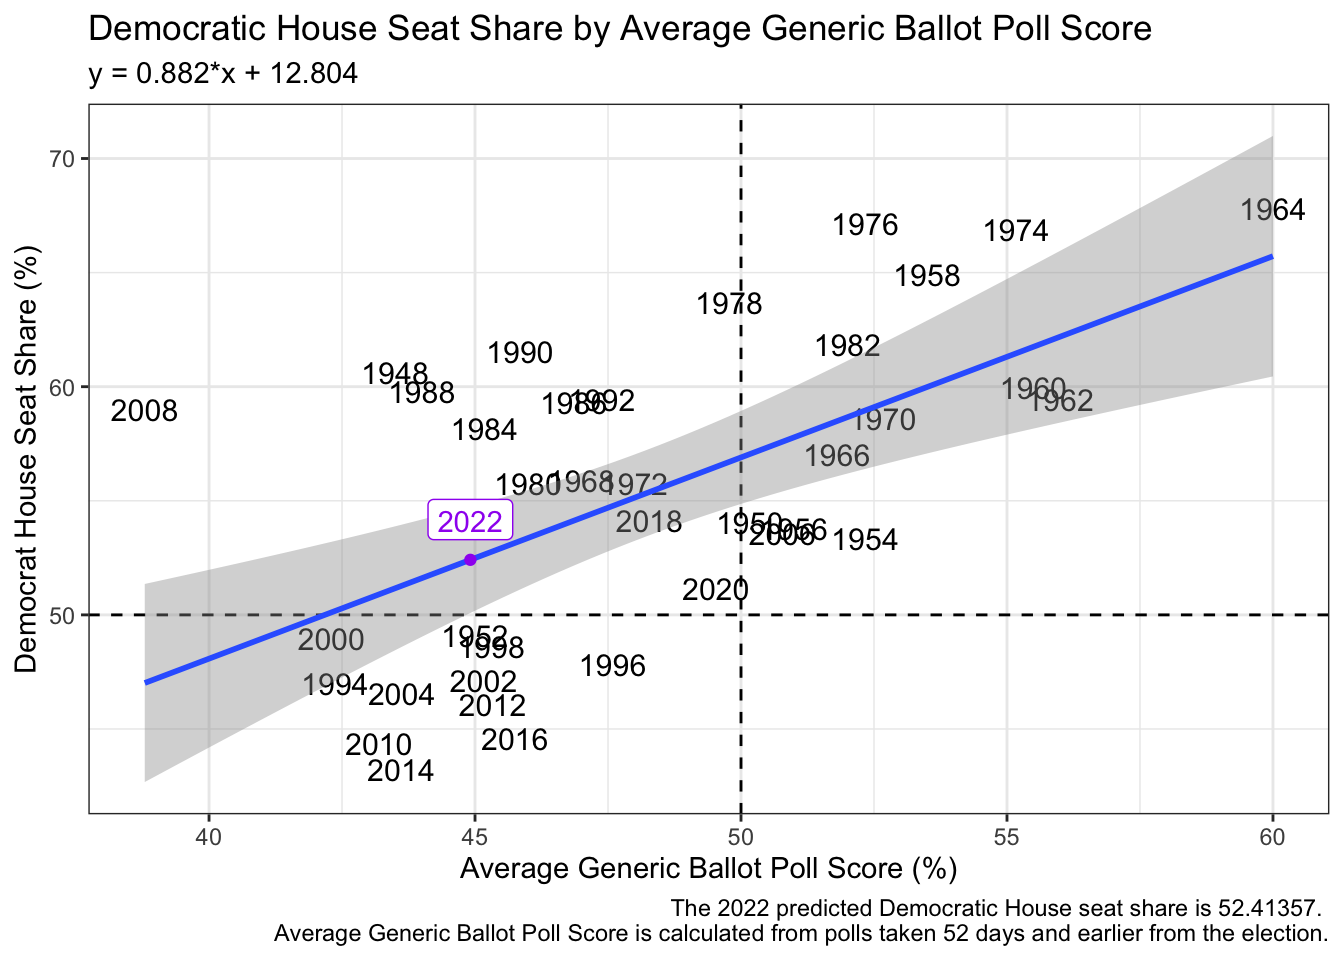
## `geom_smooth()` using formula 'y ~ x'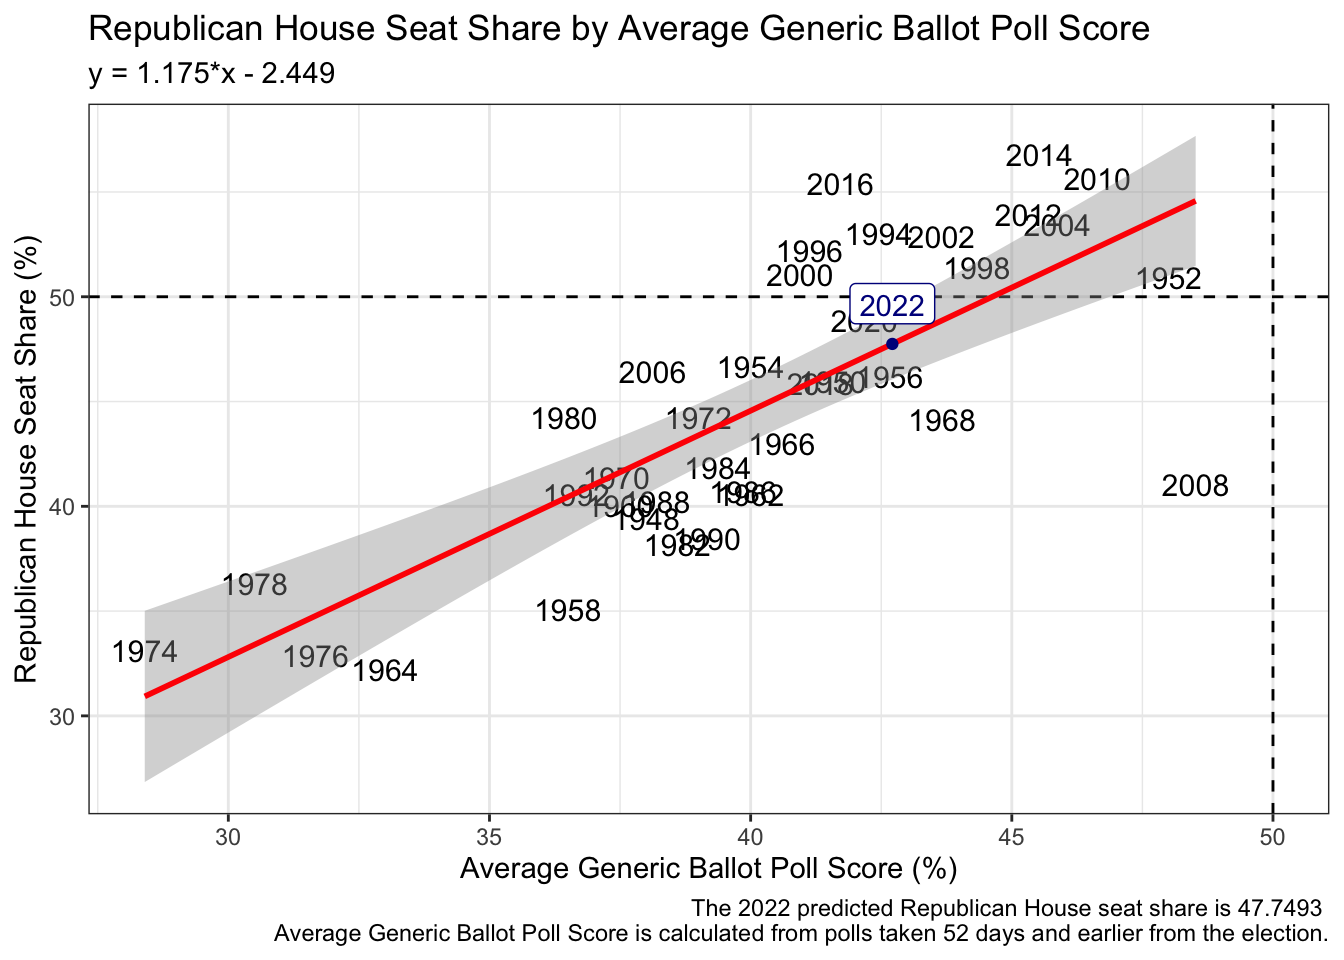
Using the latest data from FiveThirtyEight, I averaged all of the generic ballot polls for 2022 from 52 days from and closer to the election. The support for Democrats is 44.91%, while the support for Republicans is 42.71%. Then using my polling model, I predict that in the 2022 House elections Democrats will win 52% of the seat share, while the Republicans will win 48% of the seat share.
Alternative polling model without 2008
As you may see in the above prediction graphs of the Democrat and Republican seat shares, 2008 is an outlier. In fact, 2008 was an infamous year because the generic ballot polls had support for Democrats very low, but the Democrats eventually produced strong results for the 2008 elections, and vice versa for the Republicans. Thus, I present an alternative polling model that excludes 2008.
##
## ===============================================================
##                                        Dependent variable:
##                                   -----------------------------
##                                   Democrat House Seat Share (%)
## ---------------------------------------------------------------
## Average Generic Ballot Poll Score           1.053***
##                                              (0.204)
##
## Constant                                      4.165
##                                              (9.940)
##
## ---------------------------------------------------------------
## Observations                                   36
## R2                                            0.439
## Adjusted R2                                   0.422
## Residual Std. Error                      5.304 (df = 34)
## F Statistic                          26.563*** (df = 1; 34)
## ===============================================================
## Note:                               *p<0.1; **p<0.05; ***p<0.01
##
## =================================================================
## Dependent variable:
## -------------------------------
## Republican House Seat Share (%)
## -----------------------------------------------------------------
## Average Generic Ballot Poll Score 1.347***
## (0.142)
##
## Constant -8.926
## (5.704)
##
## -----------------------------------------------------------------
## Observations 36
## R2 0.725
## Adjusted R2 0.717
## Residual Std. Error 3.710 (df = 34)
## F Statistic 89.807*** (df = 1; 34)
## =================================================================
## Note: *p<0.1; **p<0.05; ***p<0.01Both the Democratic and Republican polling models that exclude 2008 have a greater R squared than their counterpart models including 2008. The new Democratic model had a R squared of 0.439, compared to the 0.346 of the previous model. The new Republican model had a R squared of 0.725, compared to the 0.606 of the previous model. In other words, the polling models improved for both Democrats and Republicans when 2008 was excluded. Under this model, the gap in seat share percentage shrinks, since the Democratic and Republican seat shares change to 51% and 49% respectively.
What happens when we add economic factors to the polling model?
Last week, my outcome variable was the incumbent party’s vote share, which had so many complications. This week, I changed the party’s House seat share (%).
##
## ===============================================================
##                                        Dependent variable:
##                                   -----------------------------
##                                   Democrat House Seat Share (%)
## ---------------------------------------------------------------
## Average Generic Ballot Poll Score            0.515**
##                                              (0.230)
##
## RDI in Q7                                  -0.0003***
##                                             (0.0001)
##
## Constant                                    37.453***
##                                             (12.396)
##
## ---------------------------------------------------------------
## Observations                                   31
## R2                                            0.566
## Adjusted R2                                   0.535
## Residual Std. Error                      4.901 (df = 28)
## F Statistic                          18.283*** (df = 2; 28)
## ===============================================================
## Note:                               *p<0.1; **p<0.05; ***p<0.01
##
## =================================================================
## Dependent variable:
## -------------------------------
## Republican House Seat Share (%)
## -----------------------------------------------------------------
## Average Generic Ballot Poll Score 0.848***
## (0.203)
##
## RDI in Q7 0.0002**
## (0.0001)
##
## Constant 5.920
## (7.189)
##
## -----------------------------------------------------------------
## Observations 31
## R2 0.685
## Adjusted R2 0.662
## Residual Std. Error 4.178 (df = 28)
## F Statistic 30.419*** (df = 2; 28)
## =================================================================
## Note: *p<0.1; **p<0.05; ***p<0.01When adding the real disposable income in Q7 of election years to the polling linear regression model, it interestingly increased the adjusted R squared of the Democratic model to 0.535, but decreased the adjusted R squared of the Republican model to 0.662. However, in both the models, the RDI in Q7, although statistically significant, had a negligible effect on the seat share. I will continue to test other economic variables now that I have switched my outcome variable to the party’s House seat share.
Conclusion
I believe I will continue using the party’s House seat share (%) as my outcome variable. In addition, I will use the average of the most recent polls as a predictor in my final prediction model of the 2022 election.
Source: Andrew Gelman and Gary King. Why are American presidential election campaign polls so variable when votes are so predictable? British Journal of Political Science, 23(4): 409–451, 1993.
Data: House Vote (given by class) House Generic Ballot Polls 1948-2020 (given by class) House Generic Ballot Polls 2022 (FiveThirtyEight)