on
Blog 4: Expert Predictions and Incumbency
Introduction:
This week, I explored expert predictions and actual results of the 2018 Congressional elections at the district level. In addition, I explore incumbency as an independent variable for future models and predictions.
2018 Congressional Elections at the District Level
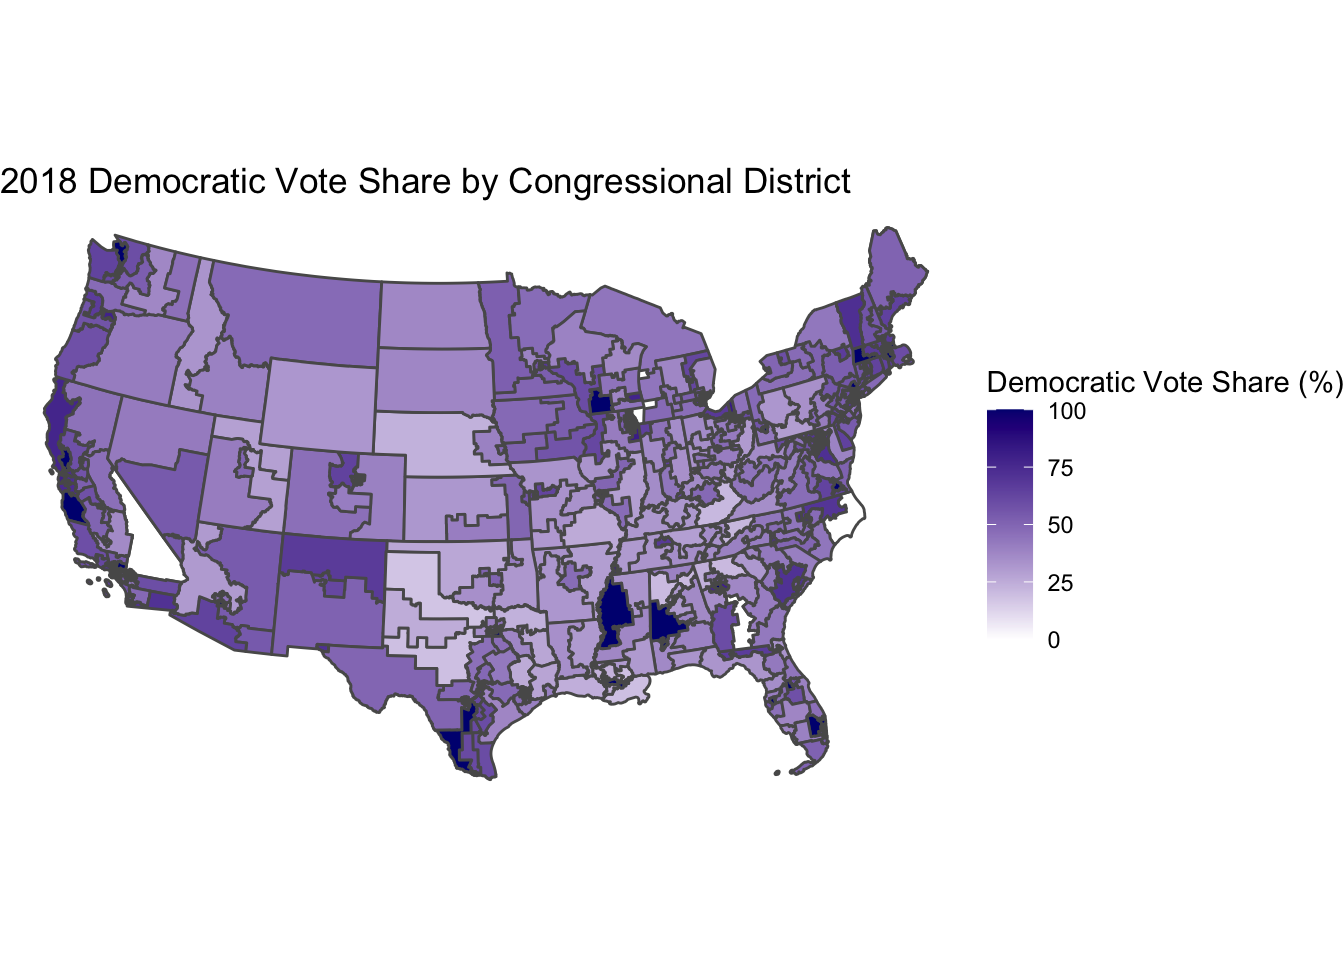
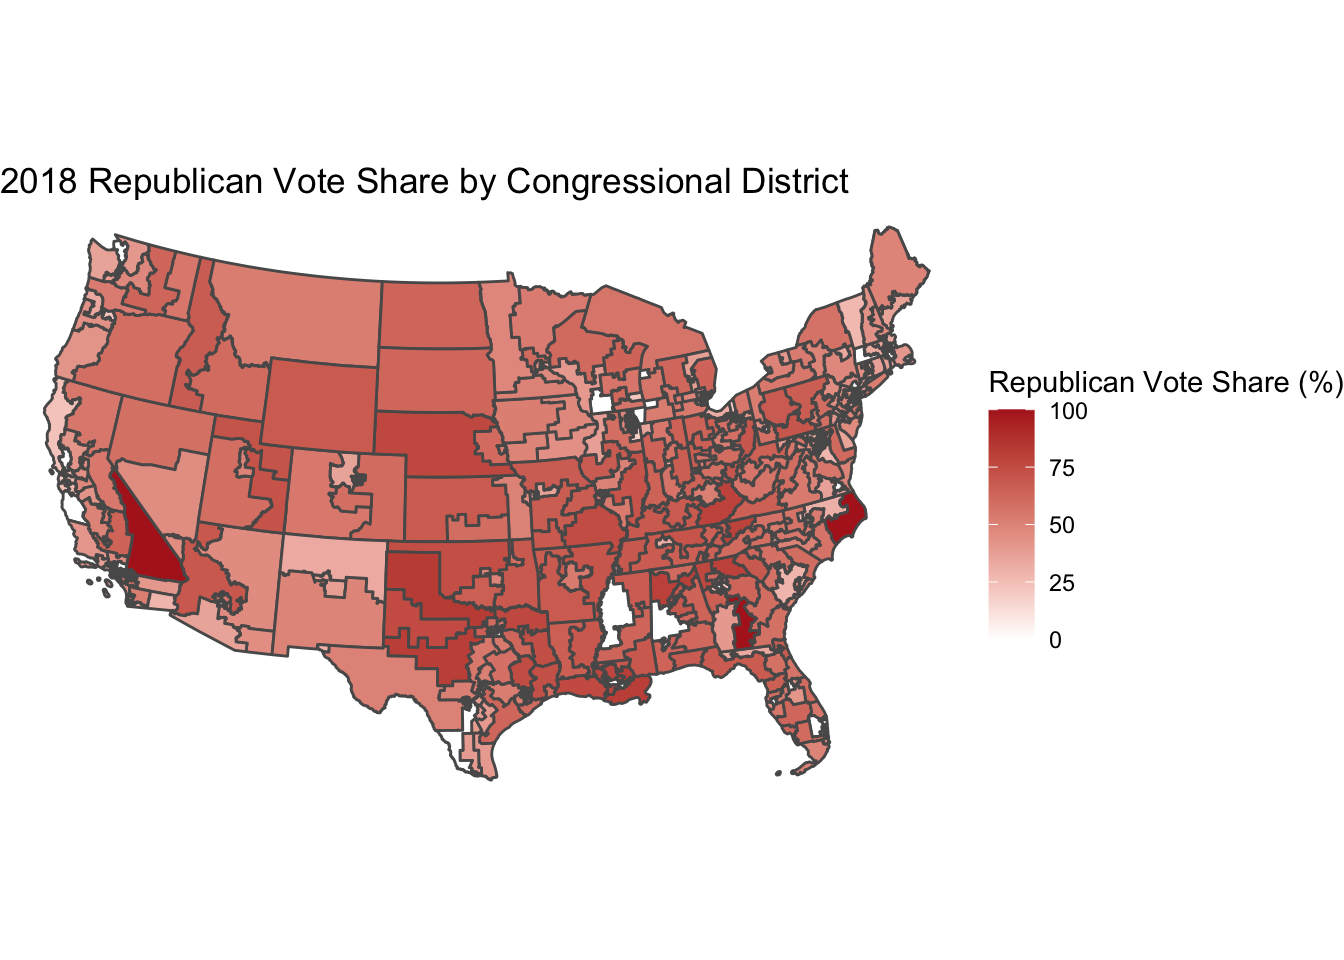
The above maps represent the Democratic and Republican vote share for each U.S. congressional district during the 2018 elections. There are districts where the vote share for either party is 0 or 100 and this is because there were uncontested elections. For example, when the Democratic vote share was 0 this means that there was an uncontested election where the Republican won. On the other hand, when the Democratic Vote share was 100 this means that there was an uncontested election where the Democrat won. In fact, there were 38 uncontested elections where the Democrat won. There were 3 uncontested elections where the Republican won.
Expert Predictions
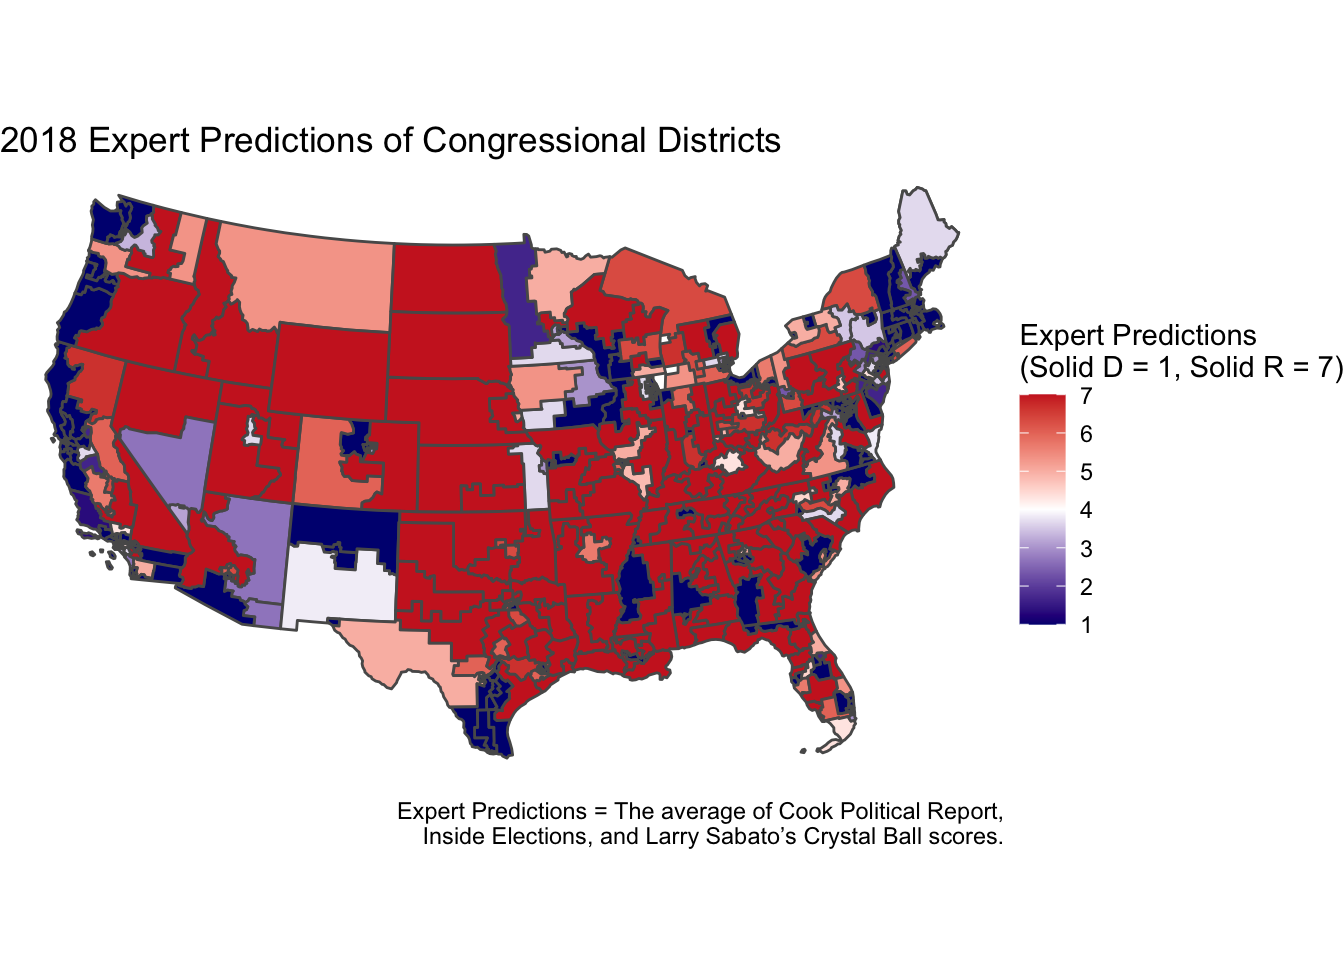
This week, I used 2018 expert predictions from Cook Political Report, Inside Elections, and Larry Sabato’s Crystal Ball. I averaged their scores on the 1-7 scale, where 1 represents Solid Democrat, 4 represents Toss-Up, and 7 represents Solid Republican. The above map represents the average expert prediction score for each congressional district.
But how accurate were these expert predictions?
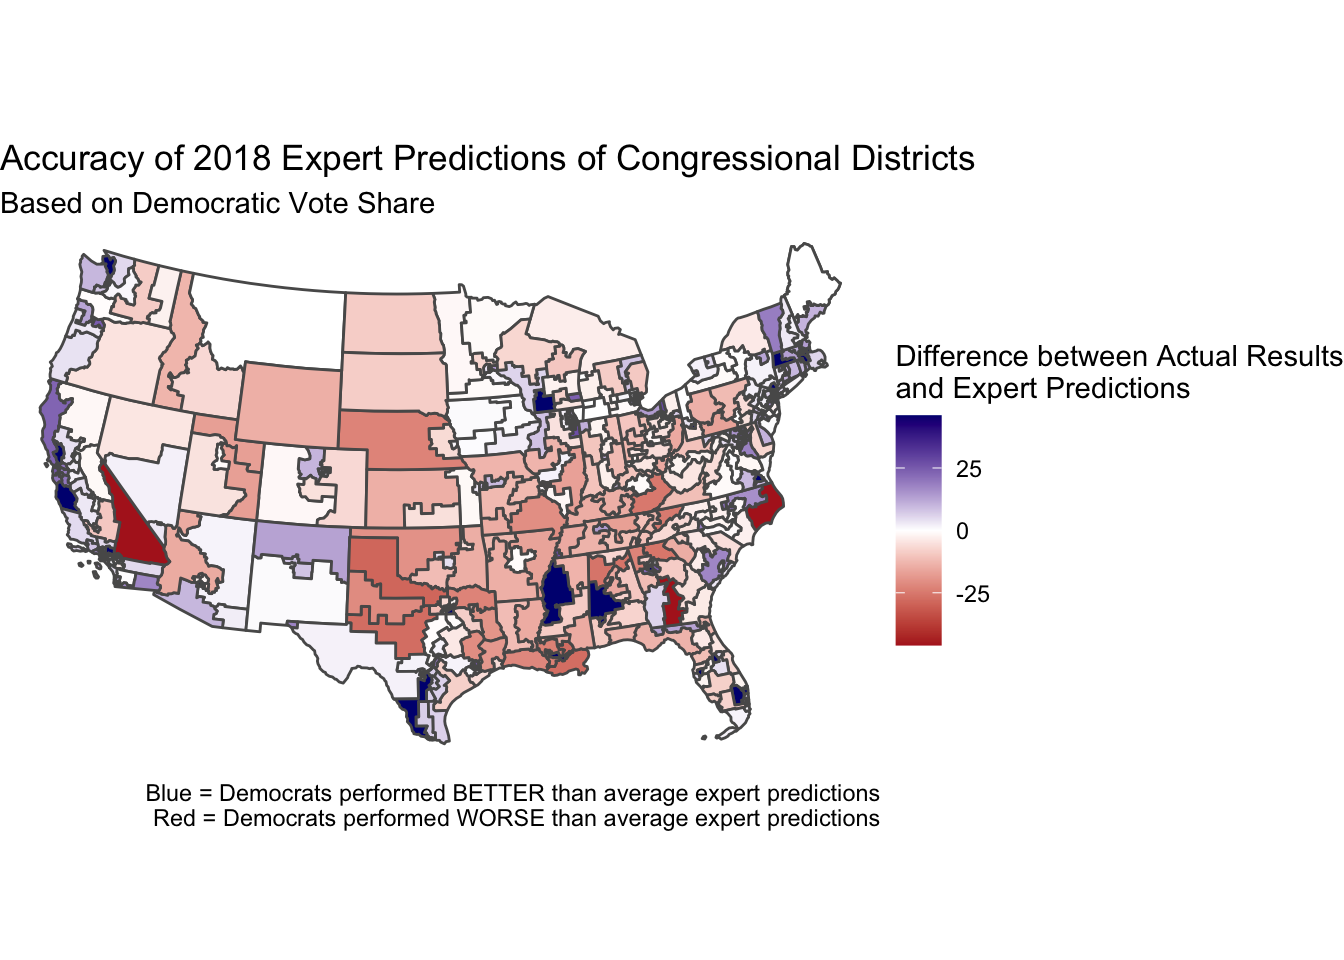
I created an accuracy map of the expert predictions based on the difference between the actual results of the election and average expert predictions. The closer to 0 (or white) the district is, the more accurate the average expert prediction was. In addition, blue represents districts where Democrats performed BETTER than average expert prediction and red represents districts where Democrats performed WORSE than average expert predictions.
The caveat to this accuracy map is that I transformed the expert prediction scores from an arbitrary scale of 7 to subjective vote share percentages. For example, for districts with a score of 1 (Solid Democrat), I gave them 54% for Democratic vote share; with a score of 7 (Solid Republican), I gave the districts 46% for Democratic vote share. Thus, this transformation of scale to vote share percentages struggles in especially districts that were uncontested. For example, although the expert predictions accurately predicted that a district with a Democratic incumbent in an uncontested election is “Solid Democrat,” the vote share will be 54%, rather than 100% giving the prediction an “error” of 46%.
Incumbency
House of Representatives incumbents in the United States enjoy electoral and structural advantages such as media coverage and campaign finance access. However, Adam Brown points out that “existing research has not asked whether individual voters actually prefer incumbents over newcomers, other things being equal.” Thus, he ran a randomized survey experiment to test this and found that “voters respond only minimally—if at all—to incumbency status once the structural advantages are held constant” (Brown, 2014). This is perhaps contrary to many people’s initial thoughts, especially when it comes to the commonly-held notion that voters like their local congressperson just because they are their local congressperson.
Using historical data from 1948-2020, I wanted to see how often incumbents won. In total, there were 2424 uncontested and 13643 contested elections. Most of the uncontested elections were won by the incumbents, but there were races where there was no incumbent candidate, only an incumbent party. Thus, I focus on contested elections to explore incumbency win rates.
I looked at the incumbent wins by party.
## # A tibble: 2 × 2
##   winner_party count
##   <chr>        <int>
## 1 D             5696
## 2 R              299
In the 5995 CONTESTED races where the Democrat was the incumbent, Democrats won 5696 times, while Republicans pulled 299 upsets. Thus, the rate at which Democratic incumbents won their CONTESTED race was a resounding 95.01%.
## # A tibble: 2 × 2
##   winner_party count
##   <chr>        <int>
## 1 D              370
## 2 R             5189
In the 5559 CONTESTED races where the Republican was the incumbent, Republicans won 5189 times while the Democrats pulled 370 upsets. The rate at which Republican incumbents won their CONTESTED race was slightly smaller than the Democrats, but nonetheless resounding, 93.34%.
Ideally, this week I would have loved to explore if incumbency at the district-level would help predict Democratic seat share, but I found that trying to measure incumbency at the district level is more complicated than meets the eye. Thus, I will take some more time to parse out the intricacies of incumbency in the future and meanwhile, just focus on the incumbent president’s party for this week.
Incumbent President’s Party
I ran a simple linear regression model trying to explain Democratic seat share percentage by whether the incumbent President’s party is Democrat.
##
## ==========================================================================
##                                                   Dependent variable:
##                                              -----------------------------
##                                              Democrat House Seat Share (%)
## --------------------------------------------------------------------------
## When Incumbent President's Party is Democrat            -0.397
##                                                         (2.310)
##
## Constant                                               55.477***
##                                                         (1.566)
##
## --------------------------------------------------------------------------
## Observations                                              37
## R2                                                       0.001
## Adjusted R2                                             -0.028
## Residual Std. Error                                 7.003 (df = 35)
## F Statistic                                       0.030 (df = 1; 35)
## ==========================================================================
## Note:                                          *p<0.1; **p<0.05; ***p<0.01
The negative coefficient of whether the incumbent President’s party is Democrat indicates that when the incumbent President’s party is Democrat, the Democratic seat share percentage is about 0.397% less than when the incumbent President’s Party is NOT Democrat aka Republican. However, it is important to note that not only was this coefficient not statistically significant, the R squared was 0.001, a very low number. Using the fact that 2022’s incumbent president’s party is Democrat, this model predicts that the Democratic seat share in 2022 will be 55.0798.
##
## ==========================================================================
##                                                   Dependent variable:
##                                              -----------------------------
##                                              Democrat House Seat Share (%)
## --------------------------------------------------------------------------
## When Incumbent President's Party is Democrat            -0.699
##                                                         (1.894)
##
## Generic Ballot Polling                                 0.885***
##                                                         (0.208)
##
## Constant                                                12.987
##                                                        (10.057)
##
## --------------------------------------------------------------------------
## Observations                                              37
## R2                                                       0.349
## Adjusted R2                                              0.310
## Residual Std. Error                                 5.738 (df = 34)
## F Statistic                                      9.095*** (df = 2; 34)
## ==========================================================================
## Note:                                          *p<0.1; **p<0.05; ***p<0.01
When I add average generic ballot polling from last week, the coefficient of whether the incumbent President’s party becomes more negative (-0.397 to -0.6993). However, once again, this coefficient is not statistically significant and the adjusted R squared is less than last week’s polling model.
Source: Adam R. Brown. Voters Don’t Care Much About Incumbency. Journal of Exper- imental Political Science, 1(2):132–143, 2014.
Data: House Vote (given by class) 118th Congressional Shapefiles (TIGRIS) Expert Predictions (given by class) House Generic Ballot Polls 1948-2020 (given by class)