on
Blog 5: The Air War - Advertisements
Introduction
This week, I explored the effect of political advertisements on the Democratic vote share at the Congressional district level. Using political advertisement data from 2006-2018, I am able to run models for 152 congressional districts. Then, I specifically looked at Pennsylvania’s 10th district to make a model that includes both Democratic advertisement share (%) and Democratic generic ballot polling and to make a prediction for this district’s Democratic vote share in 2022.
In the United States, it’s not election season without a bombardment of political ads. According to a CNBC article from September 2022, campaigns in the 2022 elections have poured $6.4 billion into TV, radio and digital ads for U.S. House, Senate, gubernatorial and local races. The 2022 election is on track to become the most expensive election ever. But do these ads actually change voters’ opinions or are they just a waste of money?
Prior Literature
Gerber and authors ran an experiment on the effects of TV and radio advertising on voting preferences. The authors found a “rapid decay of advertising effects” in which “televised ads have strong but short-lived effects on voting preferences” (Gerber et al., 2011). This matches with the exploration we did in section where we found that both Democrats and Republicans spend the most on TV ads closest to the election.
Do Ads Matter in 152 Congressional Districts from 2006-2018?
With this theoretical background, I now explore the relationship between Democratic advertisement share (the percentage of ads run in the district that were for the Democratic candidate) and Democratic vote share in 152 congressional districts from 2006-2018. My main data set that I will be using is from the Wesleyan Media Project, which tracks political TV advertisements.
I ran a simple linear regression model between Democratic vote share and Democratic ad share for 152 congressional districts. The table below shows each district’s linear regression model and its r-squared value and coefficient for Democratic ad share. To interpret the coefficient, it is for every 1% increase in Democratic ad share, there is X% increase/decrease in Democratic vote share.
## # A tibble: 152 × 4
##     state          st_cd_fips r_squared coefficient
##     <chr>          <chr>          <dbl>       <dbl>
##   1 Alabama        0102       1             0.276
##   2 Alabama        0106       0.995        -0.124
##   3 Arizona        0401       0.738         0.153
##   4 Arizona        0402       1.00          0.270
##   5 Arizona        0405       1            -0.561
##   6 Arizona        0408       0.666         1.69
##   7 Arizona        0409       1             0.173
##   8 Arkansas       0501       1             0.163
##   9 Arkansas       0502       0.120         0.180
##  10 Arkansas       0504       0.742         0.225
##  11 California     0603       1            -0.565
##  12 California     0607       1.00          0.158
##  13 California     0610       1            51.0
##  14 California     0611       1            -0.0857
##  15 California     0616       1             0.0268
##  16 California     0620       1            -0.920
##  17 California     0621       0.895         0.0880
##  18 California     0624       0.754        -0.0506
##  19 California     0636       0.661         0.191
##  20 California     0652       0.933         0.387
##  21 Colorado       0803       0.992         0.559
##  22 Colorado       0804       1            -0.360
##  23 Colorado       0806       0.0539        0.423
##  24 Colorado       0807       0.358        -0.0178
##  25 Connecticut    0902       1             0.227
##  26 Connecticut    0904       1             3.34
##  27 Connecticut    0905       0.258        -0.0710
##  28 Florida        1202       0.787        -0.291
##  29 Florida        1208       1            -0.243
##  30 Florida        1209       1             0.467
##  31 Florida        1213       0.00932       0.0808
##  32 Florida        1216       1             0.283
##  33 Florida        1218       0.738         0.269
##  34 Florida        1219       0.488         0.238
##  35 Florida        1222       0.315         0.278
##  36 Florida        1226       0.562        -0.263
##  37 Georgia        1302       1           -19.4
##  38 Georgia        1312       0.291         0.188
##  39 Hawaii         1501       0.618        -0.107
##  40 Idaho          1601       0.161        -0.177
##  41 Idaho          1602       1             0.0810
##  42 Illinois       1708       1             0.0500
##  43 Illinois       1710       0.0000389     0.00106
##  44 Illinois       1711       1            -0.336
##  45 Illinois       1712       0.173        -0.415
##  46 Illinois       1713       1            -2.37
##  47 Illinois       1717       0.0823        0.0831
##  48 Indiana        1802       0.663         0.736
##  49 Indiana        1803       1             0.333
##  50 Indiana        1807       1            -0.191
##  51 Indiana        1808       0.892         0.926
##  52 Indiana        1809       0.0245        0.0330
##  53 Iowa           1901       0.555        -0.626
##  54 Iowa           1902       0.558         0.177
##  55 Iowa           1903       0.00114      -0.0140
##  56 Iowa           1904       0.325        -0.0791
##  57 Kansas         2001       1            -0.0500
##  58 Kansas         2003       0.983         0.331
##  59 Kansas         2004       1             0.281
##  60 Kentucky       2103       0.300         0.400
##  61 Kentucky       2106       0.887         0.312
##  62 Louisiana      2203       0.663         0.628
##  63 Louisiana      2204       0.274        -0.111
##  64 Maine          2301       0.186        -0.0455
##  65 Maine          2302       0.964         1.16
##  66 Maryland       2402       1             0.128
##  67 Massachusetts  2504       1             0.282
##  68 Massachusetts  2506       0.590         0.110
##  69 Michigan       2606       0.309        -0.0849
##  70 Michigan       2607       0.999        -0.122
##  71 Michigan       2608       1             0.125
##  72 Michigan       2611       0.954         0.238
##  73 Minnesota      2702       0.944         0.127
##  74 Minnesota      2703       1             0.0225
##  75 Minnesota      2706       0.977        -0.611
##  76 Minnesota      2707       1             0.372
##  77 Minnesota      2708       0.137         0.141
##  78 Mississippi    2802       1            -2.20
##  79 Missouri       2904       1             0.521
##  80 Missouri       2908       0.0556       -0.0198
##  81 Nebraska       3102       0.570         0.394
##  82 Nevada         3203       0.870         0.317
##  83 Nevada         3204       0.918        -0.231
##  84 New Hampshire  3301       0.864         0.299
##  85 New Hampshire  3302       0.0227        0.0205
##  86 New Jersey     3403       0.781         0.0544
##  87 New Mexico     3501       0.986         0.190
##  88 New Mexico     3502       0.629         0.531
##  89 New York       3601       0.363        -0.117
##  90 New York       3603       1             0.303
##  91 New York       3618       1             0.0240
##  92 New York       3619       0.105         0.287
##  93 New York       3620       0.526         0.399
##  94 New York       3621       0.211        -0.720
##  95 New York       3622       1             0.154
##  96 New York       3623       0.225        -0.200
##  97 New York       3624       0.547        -0.734
##  98 New York       3625       0.0491        0.0528
##  99 New York       3626       1            -0.352
## 100 New York       3627       1             1.18
## 101 New York       3629       1             0.205
## 102 North Carolina 3708       0.805         0.230
## 103 North Carolina 3711       1.00          0.327
## 104 North Carolina 3713       1             0.389
## 105 Ohio           3901       0.693         0.239
## 106 Ohio           3902       1             5.58
## 107 Ohio           3905       1            -0.112
## 108 Ohio           3906       0.711         0.549
## 109 Ohio           3912       1             0.278
## 110 Ohio           3913       1             0.276
## 111 Ohio           3915       1            -5.99
## 112 Ohio           3916       1            -0.510
## 113 Ohio           3918       1            -1.19
## 114 Oklahoma       4002       1             0.419
## 115 Oklahoma       4005       0.0847        0.0229
## 116 Oregon         4101       1             0.500
## 117 Oregon         4105       0.173         0.0263
## 118 Pennsylvania   4203       1             0.00722
## 119 Pennsylvania   4204       1            -0.0984
## 120 Pennsylvania   4206       1            -1.30
## 121 Pennsylvania   4207       1           -47.9
## 122 Pennsylvania   4208       0.752        -0.0895
## 123 Pennsylvania   4210       0.758         0.447
## 124 Pennsylvania   4211       0.997         0.677
## 125 Pennsylvania   4212       0.0341       -0.0598
## 126 Pennsylvania   4216       0.00486       0.0105
## 127 Rhode Island   4401       1            -0.119
## 128 Rhode Island   4402       1             0.0767
## 129 South Carolina 4505       0.538        -0.711
## 130 Tennessee      4703       1             5.71
## 131 Tennessee      4704       0.560        -0.109
## 132 Tennessee      4709       0.335         0.0153
## 133 Texas          4815       1             0.248
## 134 Texas          4816       1            -1.65
## 135 Texas          4817       1            -5.48
## 136 Texas          4823       0.182         0.190
## 137 Texas          4827       0.907         0.324
## 138 Utah           4902       0.633         0.220
## 139 Utah           4904       0.136         0.187
## 140 Virginia       5102       0.303        -0.351
## 141 Virginia       5105       0.534         0.367
## 142 Virginia       5107       0.387         0.0606
## 143 Virginia       5109       1            -1.03
## 144 Virginia       5110       0.000441     -0.00541
## 145 Virginia       5111       1             0.119
## 146 Washington     5305       0.850         0.214
## 147 Washington     5308       0.973         0.163
## 148 West Virginia  5402       0.974         0.127
## 149 West Virginia  5403       0.639        -0.340
## 150 Wisconsin      5503       1             0.202
## 151 Wisconsin      5507       1             0.0386
## 152 Wisconsin      5508       0.0559        0.327
To better understand and visualize these 152 different linear regression models, I created graphs displaying the distributions of the coefficients and r-square values.
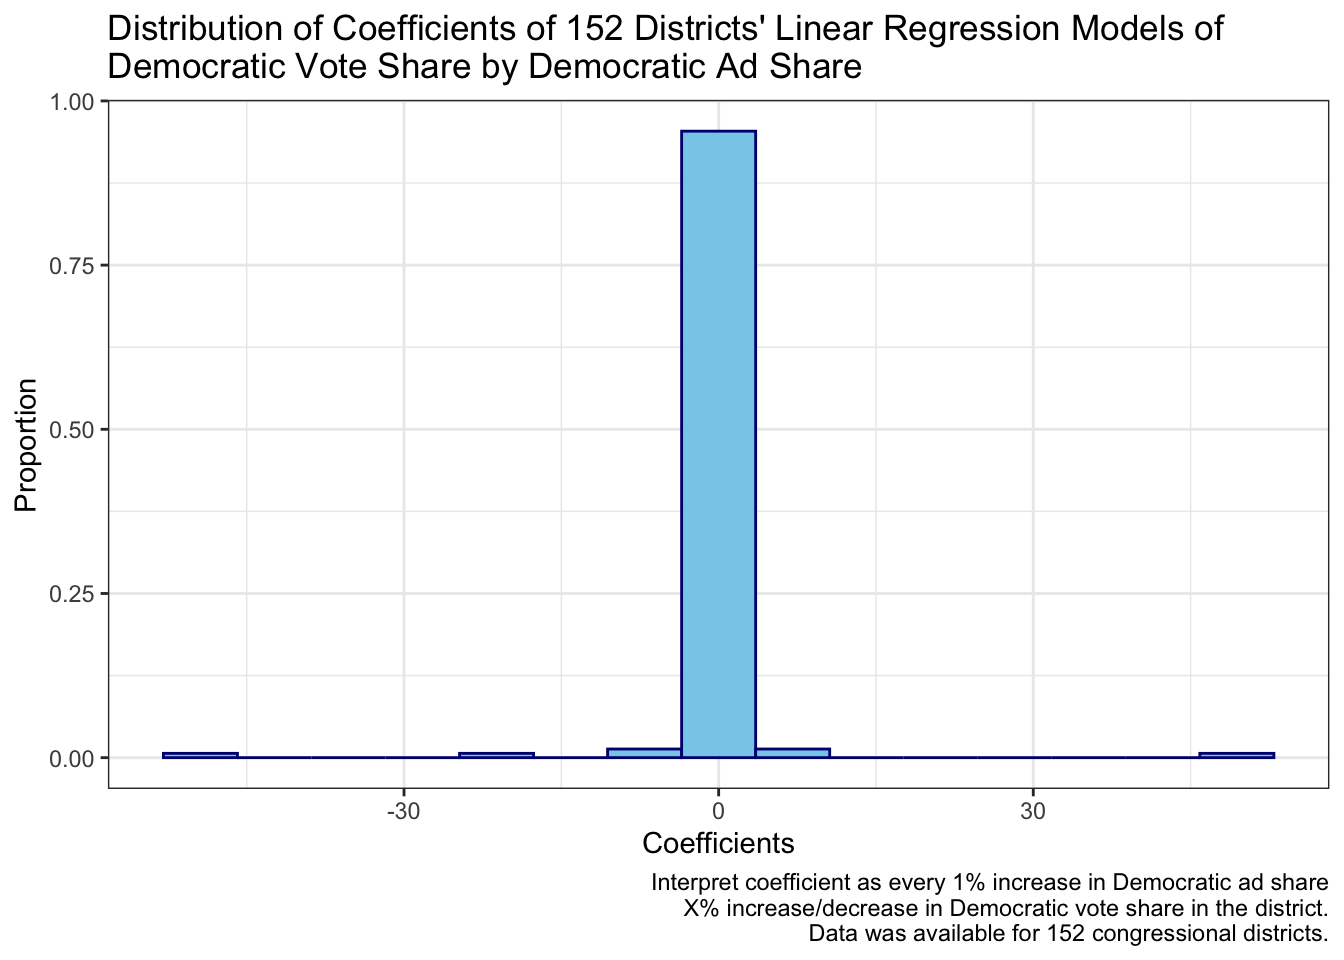
This graph is the distribution of the coefficients of 152 congressional districts from 2006-2018. Almost all of the coefficients fell in the middle “0” range. However, this graph is a bit misleading because the distribution is so widespread that it simplifies the middle of the distribution. Thus, I “zoom” into the middle of the graph to better see the distribution.
## Warning: Removed 10 rows containing non-finite values (stat_bin).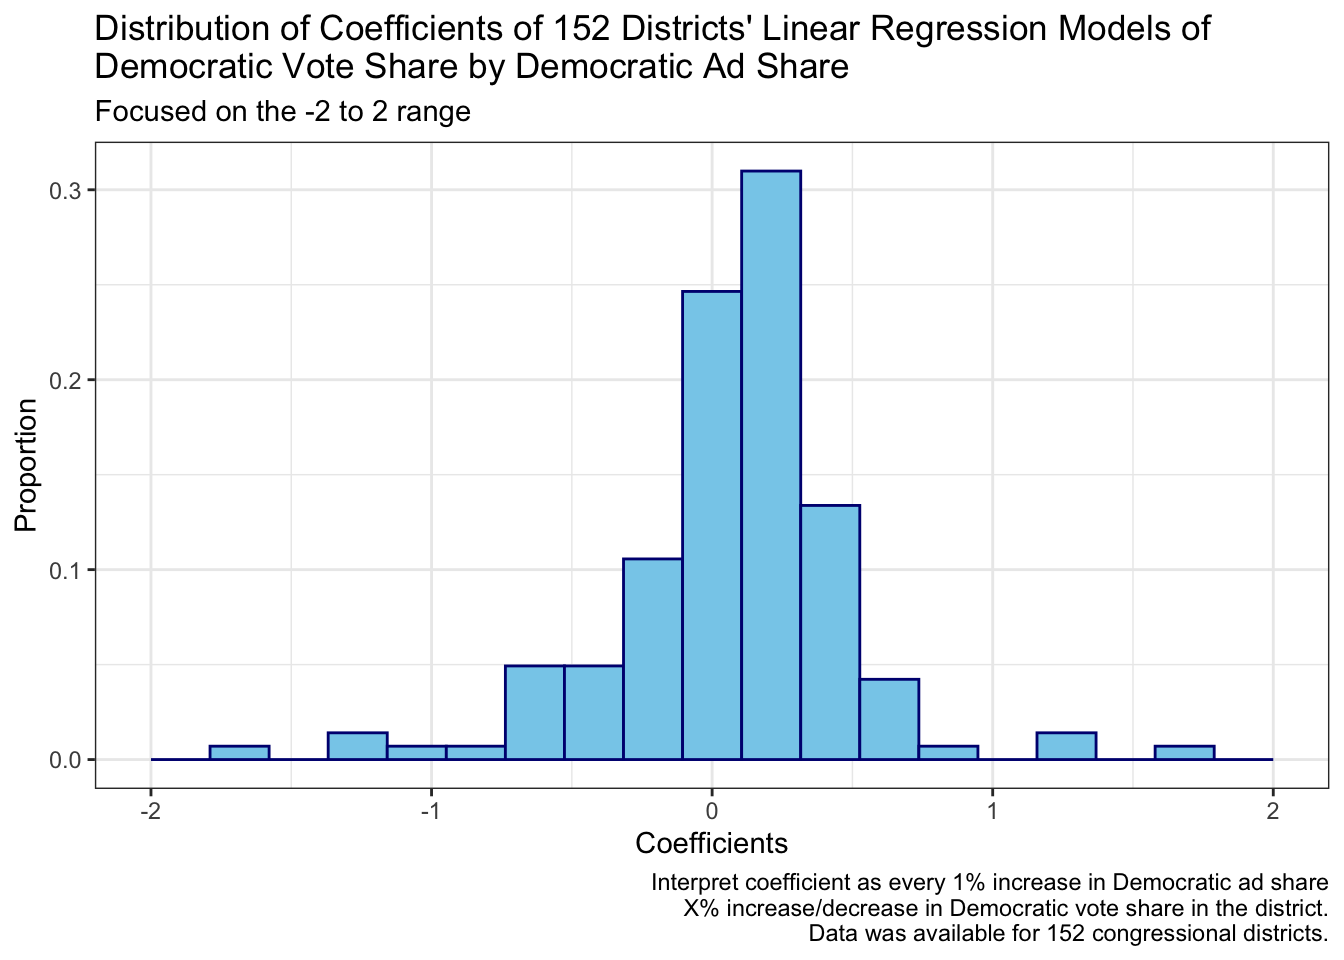
This is the same graph as above but zoomed into the -2 to 2 range. As expected, this “zoom in” has allowed for more nuance in the distribution. Although the distribution is still roughly normally shaped, there is slightly a greater concentration in the positive coefficient zone (>0). This perhaps indicates that there are more districts where there is a positive relationship between Democratic ad share and Democratic vote share than the opposite. In other words, the greater the Democratic ad share, the greater the Democratic vote share.
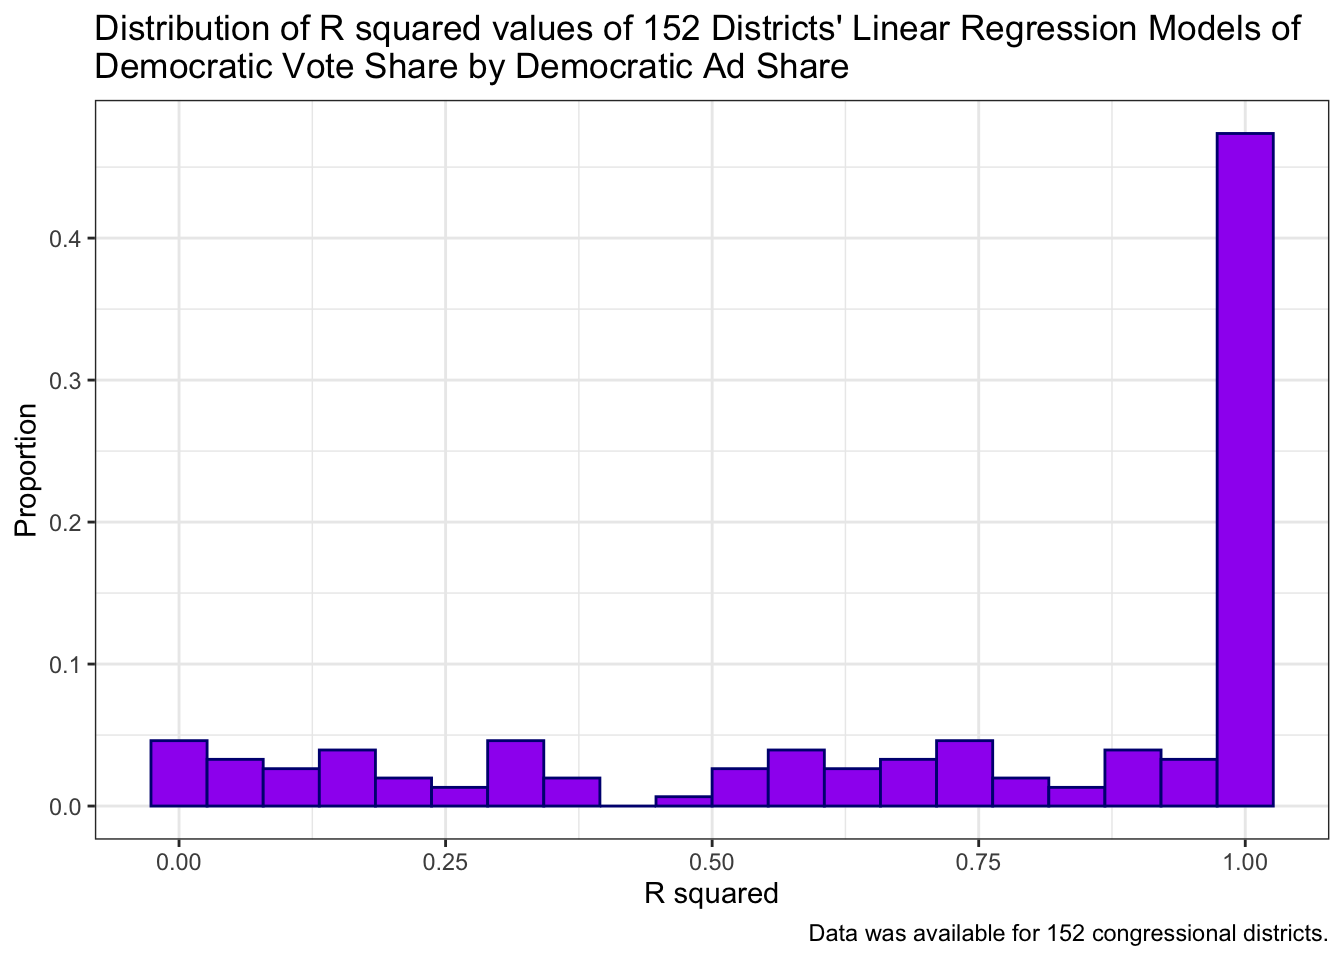
This graph is the distribution of the r-squared values of 152 congressional districts from 2006-2018. Almost 50% of the models have r-squared values of 1, which at first glance is exciting, especially considering that I have had models with negative adjusted r-squared values, but I will talk more about this in my limitations section.
Pennsylvania’s 10th Congressional District
I was not able to run predictions for all 152 congressional districts like I did with the models, so I focused on Pennsylvania’s 10th Congressional District as an example. The current district is located in [south-central region of the state]“https://en.wikipedia.org/wiki/Pennsylvania%27s_10th_congressional_district”, but this is after it was redrawn in 2018. Prior to 2019, the district was located in the northeastern part of the state. This issue of gerrymandering is further explored in my limitations section. Since 2010, the seat, in its many different forms, has been held by a Republican, but prior to 2010 it has been held by a Democrat. The elections in this district are a bit varied with close elections like in 2006 where the Democratic candidate won with 52.90% of the vote or blow out elections like in 2016 where the Republican incumbent won with 70.2% of the vote.
Besides the interesting nature of its election history, I picked PA-10 because the Wesleyan Media Project had data on it for every election between 2006-2018 except 2008.
I ran a linear regression model for Democratic vote share in PA-10 based on Democratic ad share and nation-wide generic ballot polling for the Democrats.
##
## Pennsylvania's 10th Congressional District
## ===================================================
##                             Dependent variable:
##                         ---------------------------
##                          Democratic Vote Share (%)
## ---------------------------------------------------
## Democratic Ad Share (%)           0.352**
##                                   (0.069)
##
## Generic Ballot Polling            1.440*
##                                   (0.439)
##
## Constant                          -39.773
##                                  (19.346)
##
## ---------------------------------------------------
## Observations                         5
## R2                                 0.967
## Adjusted R2                        0.935
## Residual Std. Error           2.601 (df = 2)
## F Statistic                29.664** (df = 2; 2)
## ===================================================
## Note:                   *p<0.1; **p<0.05; ***p<0.01
From this model, we see that for every 1% increase in Democratic ad share, we expect a 0.352% increase in Democratic vote share in PA-10. Similarly, for every 1% increase in the nation-wide generic ballot polling for the Democrats, we expect a 1.440% increase in Democratic vote share in PA-10. The coefficient for Democratic ad share is statistically significant at p=0.05, while the coefficient for generic ballot is statistically significant at p=0.1. Furthermore, the adjusted r-squared value is an astonishing 0.935. However, we must also account for the fact that there are only 5 observations in this model, thus the adjusted r-squared value is not perfect.
###What is the Democratic vote share prediction for Pennsylvania’s 10th district in 2022? Because the data from the Wesleyan Media Project does not have data for 2020 nor 2022, I had to use the 2018 Democratic ad share as a stand-in for 2022. This was 58.67%. In addition, I pulled October 14’s generic ballot polling for Democrats from FiveThirtyEight as the generic ballot polling for 2022. This was 45.8%.
Using the linear regression model from above and this data for 2022, I predict that the Democratic vote share for Pennsylvania’s 10th district in 2022 will be 46.84%.
Limitations
The first limitation with my 152 district models is that the distribution of r-squared values was overwhelmingly 1. This is a bit suspicious and I am in the midst of trying to figure out what happened. I did filter out all districts that only had one row (which would then result in a r-squared value of 1). The second limitation I faced was with my model for PA-10. This district went through multiple rounds of gerrymandering that makes it hard for me to predict for the current district. This raises a potential difficulty I will face if I want to continue doing district-level modeling and predicting. The third limitation is that the Wesleyan Media Project only had data up until 2018 so I had to use the 2018 data as a stand-in for 2022, but we know from earlier that this 2022 election cycle is on-track to become the most expensive, so the Democratic ad share percentage might be different. The fourth limitation is that this data only looks at TV advertisements. It would be interesting to look at if and how online political advertising affects voter behavior.
Conclusion
This week, I explored at the district-level but faced many problems. Thus, I will consider if I want to continue doing district-level predictions in the future. Nonetheless, it was a good exercise.
Data: House Vote (given by class) Wesleyan Media Project (2006-2018) (given by class) House Generic Ballot Polls 1948-2020 (given by class)