on
Blog 6: The Ground Game - Campaigns
Introduction
This week, I explore the effects of voter turnout on the Democratic vote share and seat share at the Congressional district level. Working together with Lucy Ding and Kaela Ellis, we created models for all 435 Congressional districts (for the first time this semester!). A more extensive look at all of our combined work can be found in this presentation, which we presented in class on Tuesday, October 18 to GOV 1347.
The models with voter turnout contain election data from 2012-2022. While, the models without voter turnout are more extensive with data all the way back to 1950. This blog will focus on the models with voter turnout, so please refer to our extensive presentation for this information.
Turnout Models
How did we build the turnout models?
With all of this in mind, this week, we use voter turnout as a proxy to exploring the effectiveness of campaigns.
We were able to build a model for all 435 districts! However, we were limited to only 10 years of data (2012-2022) due to the limitations with the Citizen Voting Age Population (CVAP) data that we were given. The independent variables that we used in our models were as follows: 1. District level voter turnout: (Rep Vote + Dem Vote) / CVAP 2. National Generic Ballot: The average generic ballot score for Democrats (filtered for 52 days before the election) 3. Q7->Q6 Percent Difference in GDP: The percent difference in GDP from Q6 to Q7 4. Incumbency: Whether or not the Democratic party is the incumbent party
Example model of a district: Wyoming
##
## ==================================================
##                            Dependent variable:
##                        ---------------------------
##                           DemVotesMajorPercent
## --------------------------------------------------
## average_support                   1.347
##                                  (1.397)
##
## turnout                           0.089
##                                  (0.313)
##
## gdp_percent_difference           -0.379
##                                  (0.323)
##
## incumb
##
##
## Constant                         -36.698
##                                 (60.562)
##
## --------------------------------------------------
## Observations                        5
## R2                                0.614
## Adjusted R2                      -0.544
## Residual Std. Error          4.485 (df = 1)
## F Statistic                 0.530 (df = 3; 1)
## ==================================================
## Note:                  *p<0.1; **p<0.05; ***p<0.01
Here is an example linear regression model of one district (WY-AL). Using a for loop, we then ran the linear regression model 435 times for all 435 districts.
This particular model is not so good. None of the variables are significant. The adjusted r-squared is negative. Since incumbency was the same over the 10 year period, it was not regressed on. To see an improved version of this model, please see our model WITHOUT voter turnout.
Evaluation of the 435 models
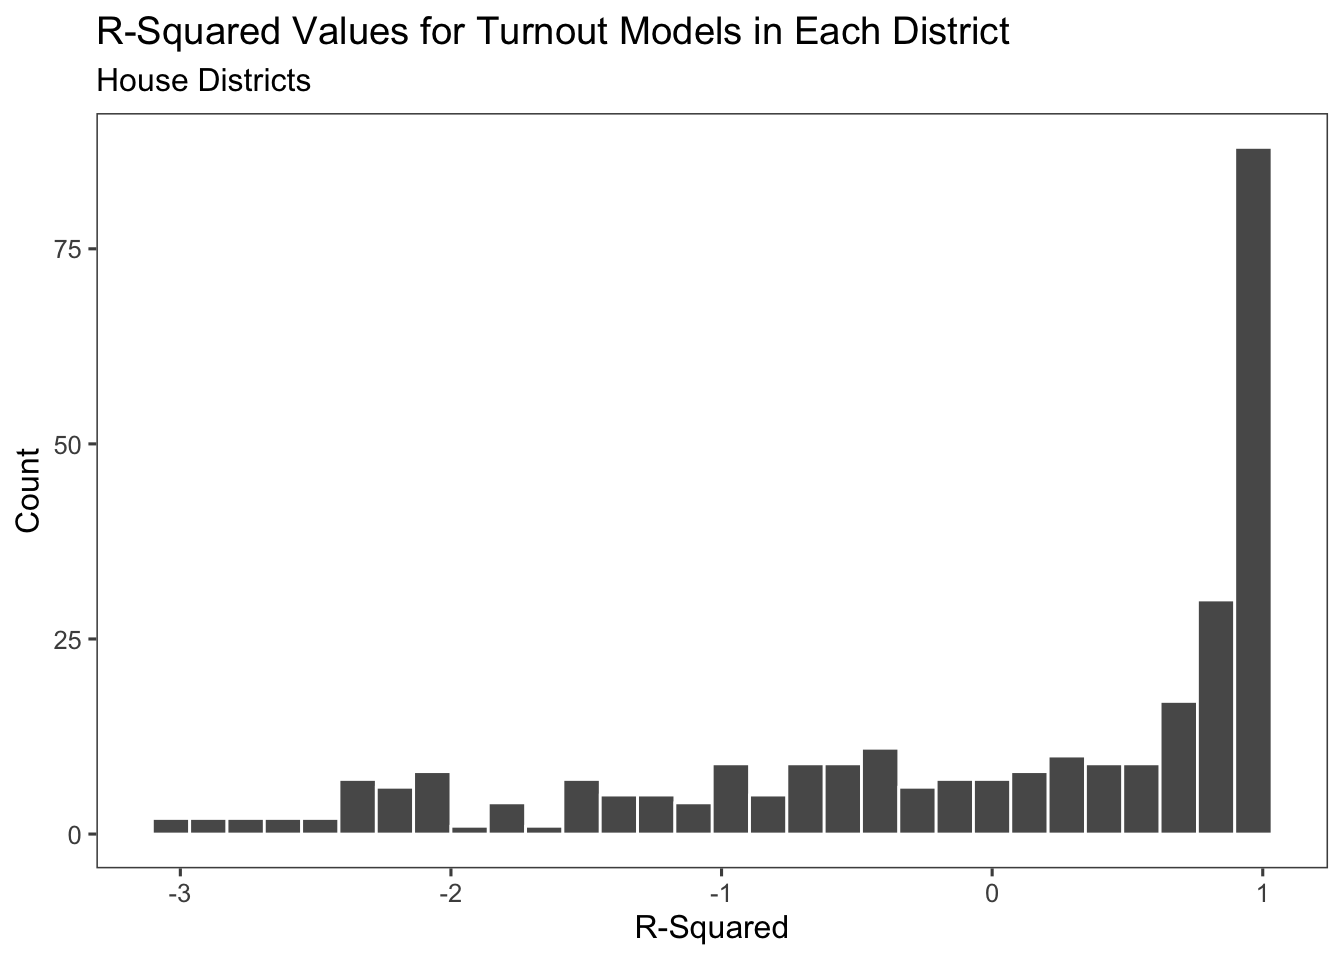
Here is a distribution of the r-squared values. It is a bit concerning that we have negative values and then a high concentration of 1s.
But we may be able to still learn something from it!
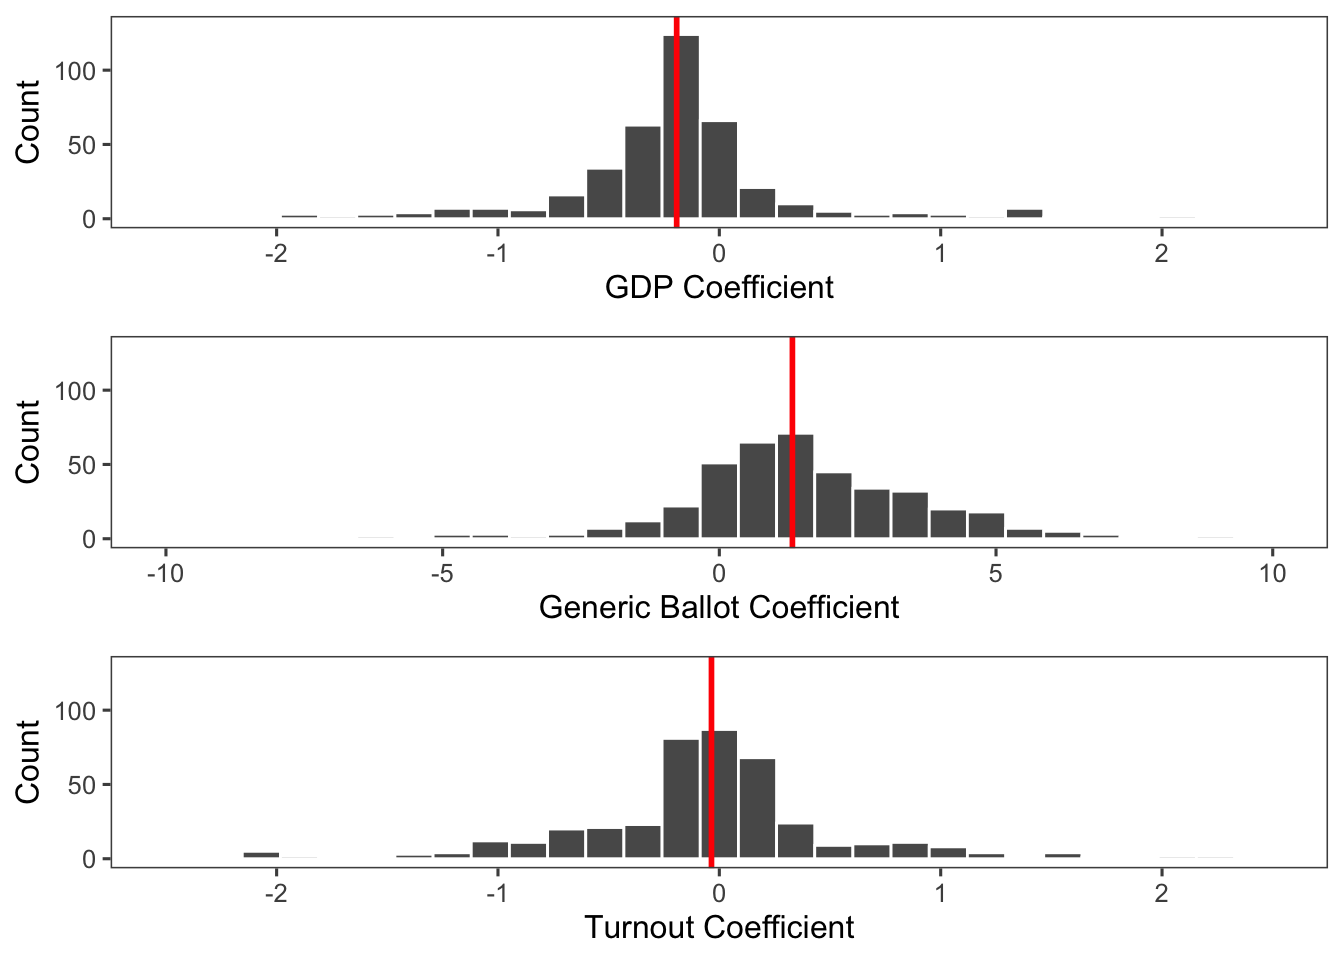
The left graph is a distribution of all the GDP coefficients. Median GDP coefficient is negative. This indicates that as GDP increases, Democratic vote share decreases. We saw this trend also in our models without voter turnout and so it is very interesting. It is a bit counterintuitive because one would expect a better economy should benefit Democrats. However, this could indicate that when using the economy we should regress on the president’s party.
The middle graph is a distribution of all the generic ballot coefficients. Median generic ballot coefficient is positive. This as average Democratic support, Democratic vote share increases. This trend was also seen in our models without voter turnout and it intuitively makes sense.
The right graph is a distribution of all the generic ballot coefficients. Median turnout coefficient was essentially zero. This indicates that perhaps voter turnout (and as a proxy campaigns) are not that effective at predicting Democratic two-party vote share.
Predictions for 2022
How did we make predictions for 2022?
Voter turnout: We imputed 2022 turnout data by averaging 2014 and 2018 data (midterm elections). We then calculated a low, middle, and high turnout universe with +- 8 points from the average voter turnouts found above
Generic ballot: The average generic ballot for Democrats from FiveThirtyEight on October 16, 2022: 45.6%
GDP: Q2-Q1 change: -0.6
Incumbency: from 2020 election results
District-Level Predictions Adjusted By Turnout
We created three predictions based on low turnout, average turnout, and high turnout. We determined seat predictions based on if the Democratic two-party vote share was below 50% then that was a Republican seat and if it was above 50% then that was a Democratic seat.
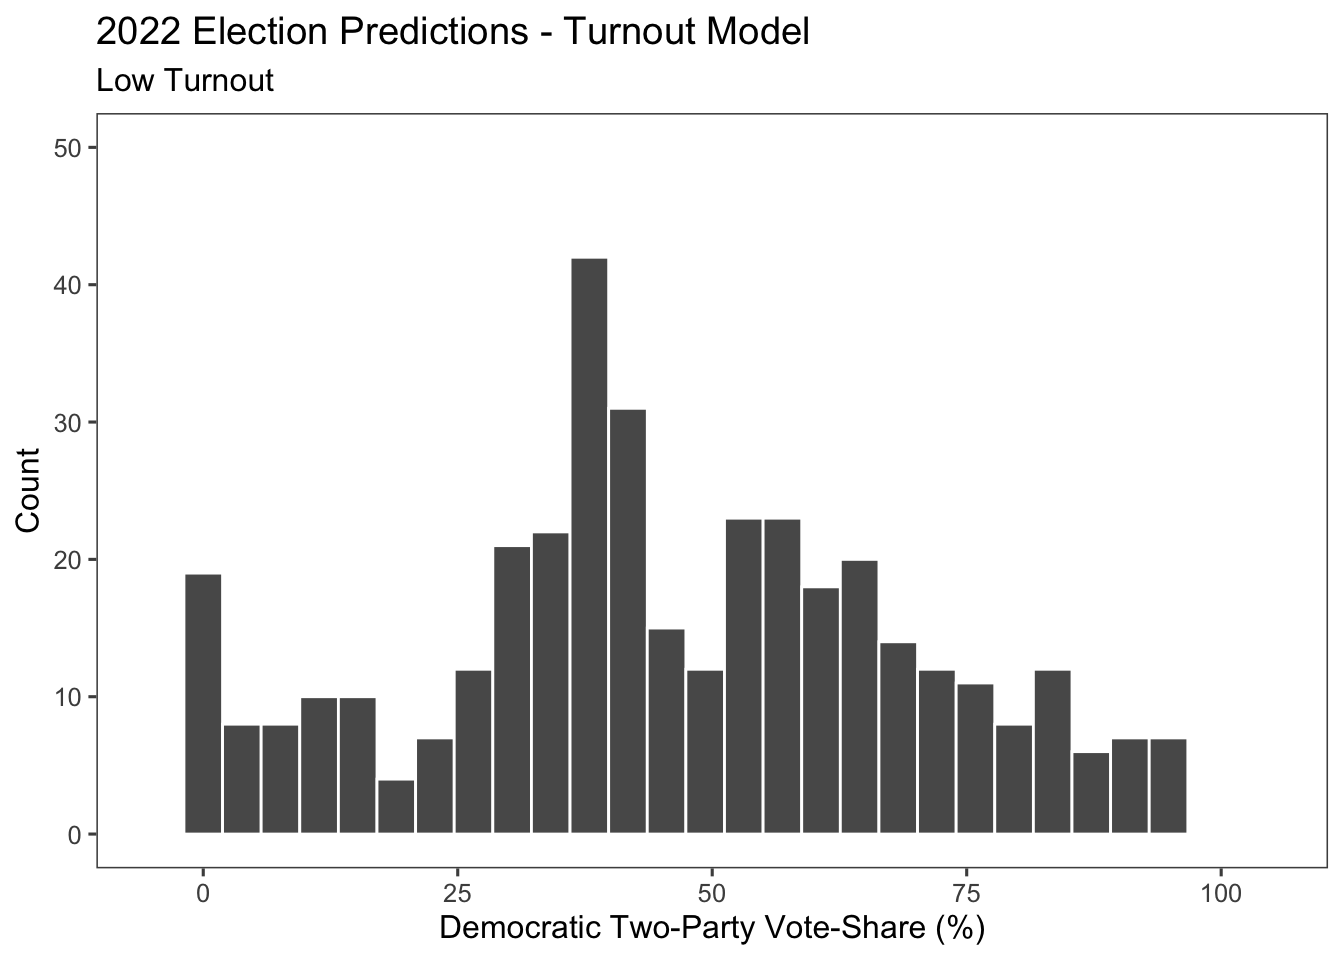
In the low turnout scenario (-8 percentage points from average turnout in the district), we predict that Republicans will win 215 seats, while the Democrats will win 220 seats. The low turnout scenario predicts a Democratic win in the House.
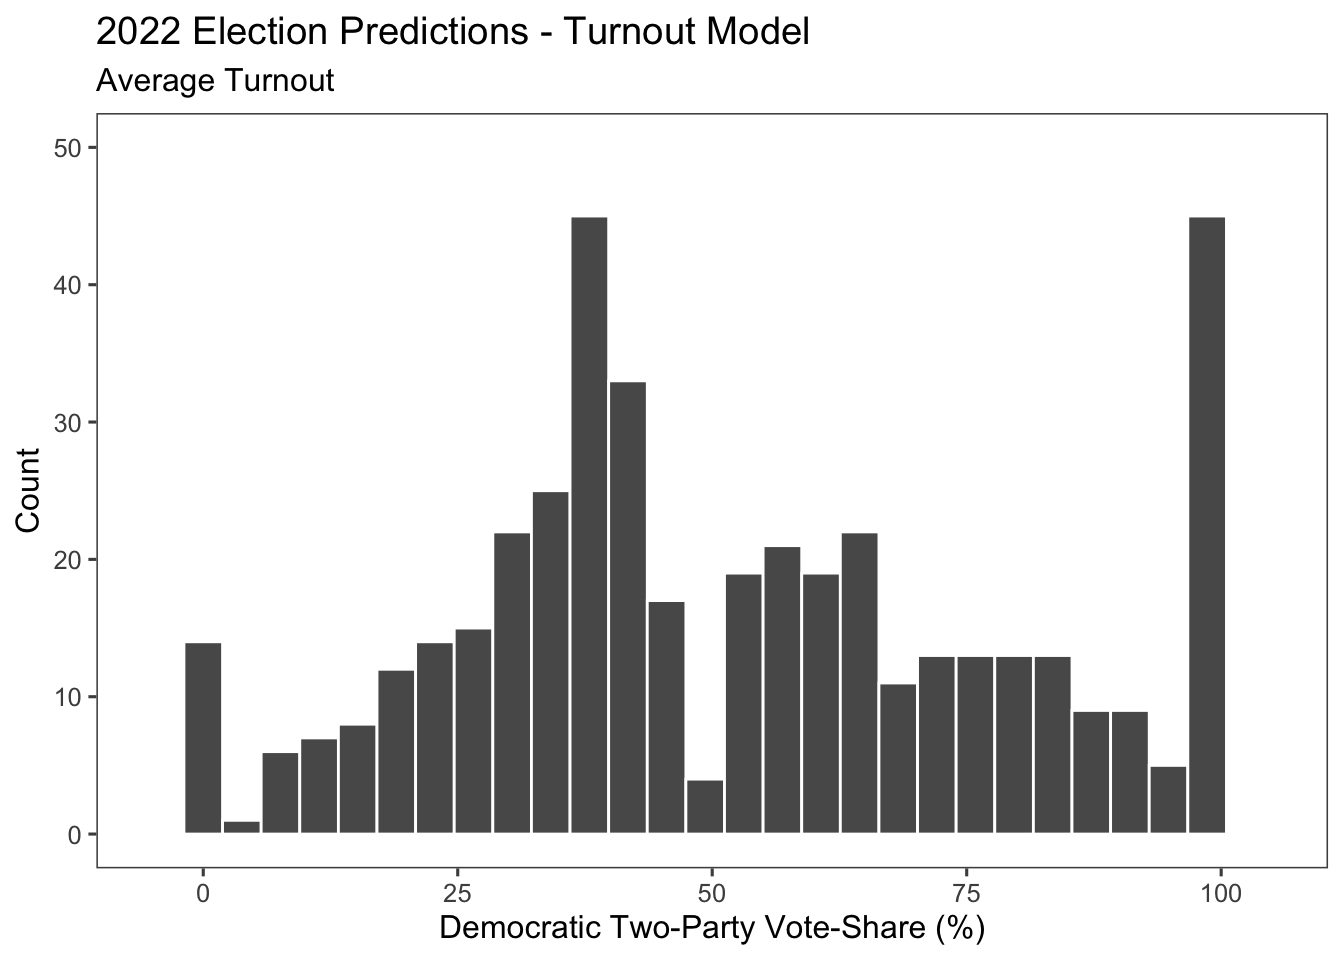
In the average turnout scenario, we predict that Republicans will win 221 seats, while the Democrats will win 214 seats. The average turnout scenario predicts a Republican win in the House.
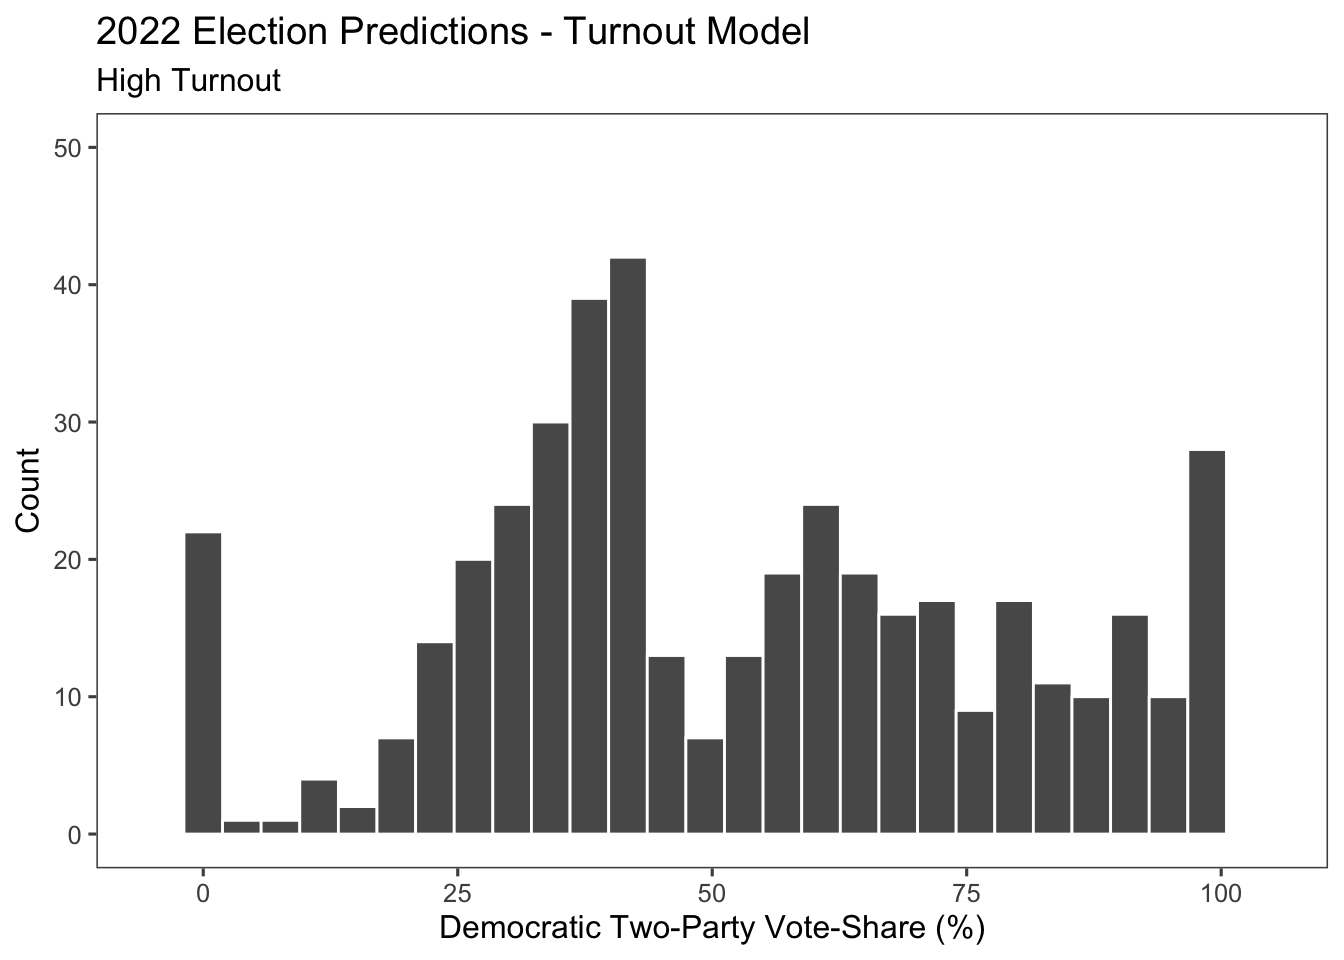
In the high turnout scenario (+8 percentage points from average turnout in the district), we predict that Republicans will win 224 seats, while the Democrats will win 211 Seats. The high turnout scenario predicts a Republican win in the House.
These predictions go against conventional thought that Democrats perhaps benefit from higher turnout because it is only in the low turnout scenario that Democrats win. However, recent literature has also debunked this notion.
Limitations
One of the main limits of this exploration was that with our given data set, voter turnout as a variable was very limiting because we only had data from 2012-2020. In addition, we had to create predictions for 2022 voter turnout at the district level in order to create predictions for 2022 Democratic two-party vote share. There could have been some methodological problems with our predictions for voter turnout.
In addition, the economic variable of GDP perhaps is a better explainer for incumbent party’s or president’s party vote share, instead of Democratic vote share. Going forward, we may want to consider the interaction of GDP with the president’s party for example.
Finally, we wonder if voter turnout is even the best proxy for evaluating campaigns. Perhaps, the number of local campaign offices could be a better predictor. However, voter turnout, despite its limitations, could be the most accessible data set.
Conclusion
Despite limitations, I am proud that we were able to run models for all 435 districts for the first time.
If you are interested in the models without voter turnout, which had more predictive power and had an interesting result, please refer to the presentation slides. The only difference is that these models removed voter turnout as a variable and used data from 1950-2022. The trends of the distribution of the coefficients of the variables are the same as the models with voter turnout. However, interestingly, without voter turnout, we predict that the Republicans will win 215 seats, while the Democrats will win 220 seats. Thus, the models without voter turnout predict a Democratic victory in the House, opposite to our average and high voter turnout models.
Data: Citizen Voting Age Population (given by class) GDP quarterly data (given by class) House Vote to determine incumbency (given by class) House Generic Ballot Polls 2022 (FiveThirtyEight)